SECURITIES AND EXCHANGE COMMISSION
THE SECURITIES EXCHANGE ACT OF 1934
[ ] TRANSITION REPORT PURSUANT TO SECTION 13 OR 15(d) OF
THE SECURITIES EXCHANGE ACT OF 1934
Commission File No. 0-5108
Massachusetts (State or other jurisdiction of incorporation) One Lincoln Street Boston, Massachusetts (Address of principal executive office) |
04-2456637 (I.R.S. Employer Identification No.) 02111 (Zip Code) |
||
(Registrant’s telephone number, including area code)
Securities registered pursuant to Section 12(b) of the Act:
| (Title of Each Class) |
(Name of each exchange on which registered) |
|||||
|---|---|---|---|---|---|---|
Common Stock, $1
par value Preferred share purchase rights |
Boston Stock
Exchange New York Stock Exchange Archipelago Stock Exchange |
|||||
None
| Large accelerated filer |X| | Accelerated Filer |_| | Non- Accelerated filer |_| | |||
(1) |
The registrant’s definitive Proxy Statement for the 2006 Annual Meeting to be filed pursuant to Regulation 14A on or before April 30, 2006 (Part III). |
Table of Contents
| Description |
Page Number |
|||||||||
|---|---|---|---|---|---|---|---|---|---|---|
PART
I |
||||||||||
Item
1 |
Business |
1 | ||||||||
Item
1A |
Risk Factors |
5 | ||||||||
Item
1B |
Unresolved Staff Comments |
10 | ||||||||
Item
2 |
Properties |
10 | ||||||||
Item
3 |
Legal Proceedings |
10 | ||||||||
Item
4 |
Submission of Matters to a Vote of Security Holders |
10 | ||||||||
Item
4A |
Executive Officers of the Registrant |
11 | ||||||||
PART
II |
||||||||||
Item
5 |
Market for Registrant’s Common Equity and Related Stockholder Matters |
12 | ||||||||
Item
6 |
Selected Financial Data |
14 | ||||||||
Item
7 |
Management’s Discussion and Analysis of Financial Condition and Results of Operations |
15 |
||||||||
Item
7A |
Quantitative and Qualitative Disclosures About Market Risk |
58 | ||||||||
Item
8 |
Financial Statements and Supplementary Data |
59 | ||||||||
Item
9 |
Changes in and Disagreements with Accountants on Accounting and Financial Disclosure |
107 |
||||||||
Item
9A |
Controls and Procedures |
107 | ||||||||
Item
9B |
Other Information |
110 | ||||||||
PART
III |
||||||||||
Item
10 |
Directors and Executive Officers of the Registrant |
110 | ||||||||
Item
11 |
Executive Compensation |
110 | ||||||||
Item
12 |
Security Ownership of Certain Beneficial Owners and Management and Related Stockholder Matters |
110 |
||||||||
Item
13 |
Certain Relationships and Related Transactions |
111 | ||||||||
Item
14 |
Principal Accountant Fees and Services |
111 | ||||||||
PART
IV |
||||||||||
Item
15 |
Exhibits and Financial Statement Schedules |
112 | ||||||||
Signatures |
118 | |||||||||
Exhibits |
||||||||||
and trusteeship of collective trust funds and separate accounts offered to employee benefit plans subject to ERISA is subject to regulation by the U.S. Department of Labor.
investments in mutual funds, other collective investment funds, and defined contribution plans, our revenue may be adversely affected.
transactions, which could have an adverse impact on our results of operations. Additionally, the Financial Accounting Standards Board has been considering making changes to the accounting guidance related to uncertain tax positions and leveraged leases. While such changes may not have an economic impact on our business, these changes could affect the attainment of our current financial goals.
special purpose entities we administer could experience deterioration in asset performance. This could result in higher levels of credit-related losses, which could adversely affect our earnings.
| Name | Age | Position | Year Elected (1) | |||
|---|---|---|---|---|---|---|
Ronald
E. Logue |
60 |
Chairman and Chief Executive Officer |
2004 | |||
Joseph
C. Antonellis |
51 | Executive Vice President and Chief Information Officer |
1999/2002 | |||
Jeffrey
N. Carp |
49 | Executive Vice President and Chief Legal Officer |
2006 | |||
Joseph
W. Chow |
53 | Executive Vice President |
1996 | |||
Charles
C. Cutrell, III |
51 | Executive Vice President, General Counsel and Secretary |
2004 | |||
Pamela
D. Gormley |
57 | Executive Vice President and Corporate Controller |
2004 | |||
Joseph
L. Hooley |
48 | Executive Vice President |
2000 | |||
William
W. Hunt |
43 | Executive Vice President; President and Chief Executive Officer, State
Street Global Advisors |
2001/2005 | |||
Edward
J. O’Brien |
51 | Executive Vice President and Treasurer |
2001/2005 | |||
David
C. O’Leary |
59 | Executive Vice President |
2005 | |||
James
S. Phalen |
55 | Executive Vice President |
1992 | |||
Edward
J. Resch |
53 | Executive Vice President and Chief Financial Officer |
2002 | |||
Stanley
W. Shelton |
51 | Executive Vice President |
1995 |
(1) |
For officers where two years are listed, the first year indicates the year they were elected as executive vice president, and the second year indicates the year they received the additional title as it appears in the table. |
ITEM 5. |
MARKET FOR REGISTRANT’S COMMON EQUITY AND RELATED STOCKHOLDER MATTERS |
| Number
of Shares Purchased |
Average
Price Per Share |
Number
of Shares Purchased Under Publicly Announced Program |
Maximum Number of Shares Yet to Be Purchased Under Publicly Announced Program |
||||||||
|---|---|---|---|---|---|---|---|---|---|---|---|
| (Shares
in thousands) |
|||||||||||
October
1 – October 31, 2005 |
938 | $54.29 | 927 | 8,797 | |||||||
November
1 – November 30, 2005 |
2,089 | 57.03 | 2,089 | 6,708 | |||||||
December 1 – December 31, 2005 |
1,905 | 58.52 | 1,905 | 4,803 | |||||||
Total |
4,932 | 4,921 | |||||||||
| 2005 | 2004 | 2003 | 2002 | 2001 | |||||||||||||||||
|---|---|---|---|---|---|---|---|---|---|---|---|---|---|---|---|---|---|---|---|---|---|
| (Dollars in millions, except per share data or where otherwise indicated) | |||||||||||||||||||||
| FOR
THE YEAR ENDED DECEMBER 31: |
|||||||||||||||||||||
| Total
fee revenue |
$ | 4,551 | $ | 4,048 | $ | 3,556 | $ | 2,850 | $ | 2,769 | |||||||||||
| Net
interest revenue |
907 | 859 | 810 | 979 | 1,025 | ||||||||||||||||
| Provision
for loan losses |
– | (18 | ) | – | 4 | 10 | |||||||||||||||
| (Losses)
gains on sales of available-for-sale investment securities, net |
(1 | ) | 26 | 23 | 76 | 43 | |||||||||||||||
| Gain
on sale of Private Asset Management business, net of exit and other associated
costs |
16 | – | 285 | – | – | ||||||||||||||||
| Gain
on sale of Corporate Trust business, net of exit and other associated costs |
– | – | 60 | 495 | – | ||||||||||||||||
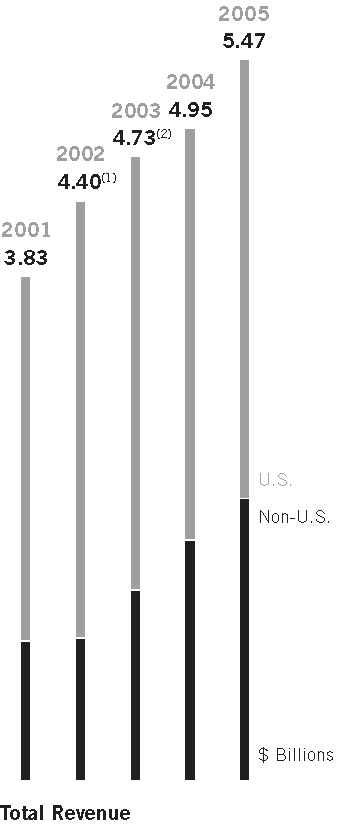
| Total
revenue |
5,473 | 4,951 | 4,734 | 4,396 | 3,827 | ||||||||||||||||
| Total
operating expenses |
4,041 | 3,759 | 3,622 | 2,841 | 2,897 | ||||||||||||||||
| Income
from continuing operations before income tax expense |
1,432 | 1,192 | 1,112 | 1,555 | 930 | ||||||||||||||||
| Income
tax expense from continuing operations |
487 | 394 | 390 | 540 | 302 | ||||||||||||||||
| Income
from continuing operations |
945 | 798 | 722 | 1,015 | 628 | ||||||||||||||||
| Net
loss from discontinued operations |
(107 | ) | – | – | – | – | |||||||||||||||
| Net
income |
$ | 838 | $ | 798 | $ | 722 | $ | 1,015 | $ | 628 | |||||||||||
| PER
COMMON SHARE: |
|||||||||||||||||||||
| Basic
earnings: |
|||||||||||||||||||||
| Continuing
operations |
$ | 2.86 | $ | 2.38 | $ | 2.18 | $ | 3.14 | $ | 1.94 | |||||||||||
| Net
income |
2.53 | 2.38 | 2.18 | 3.14 | 1.94 | ||||||||||||||||
| Diluted
earnings: |
|||||||||||||||||||||
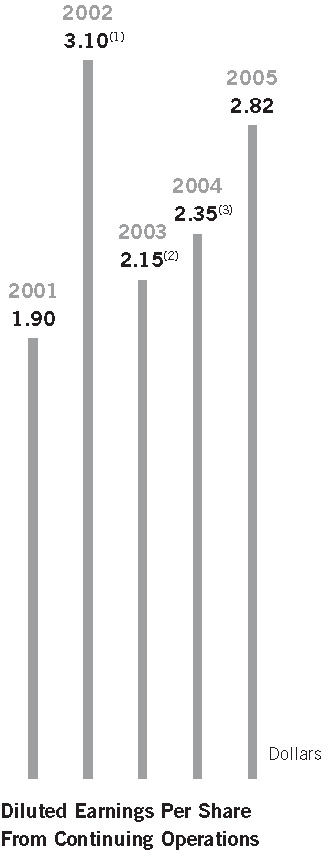
| Continuing
operations |
2.82 | 2.35 | 2.15 | 3.10 | 1.90 | ||||||||||||||||
| Net
income |
2.50 | 2.35 | 2.15 | 3.10 | 1.90 | ||||||||||||||||
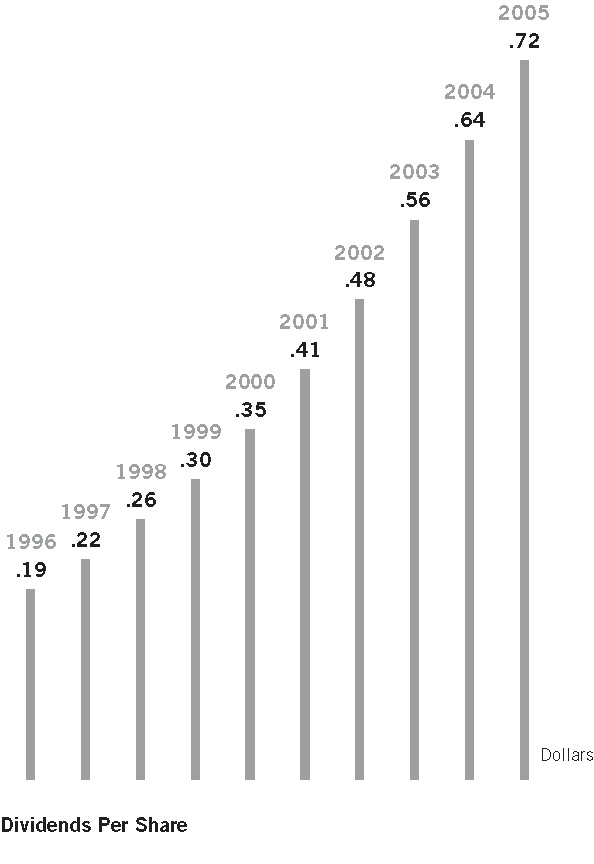
| Cash
dividends declared |
.72 | .64 | .56 | .48 | .41 | ||||||||||||||||
| Closing
price of common stock |
55.44 | 49.12 | 52.08 | 39.00 | 52.25 | ||||||||||||||||
| AT
YEAR-END: |
|||||||||||||||||||||
| Investment
securities |
$ | 59,870 | $ | 37,571 | $ | 38,215 | $ | 28,071 | $ | 20,781 | |||||||||||
| Total
assets |
97,968 | 94,040 | 87,534 | 85,794 | 69,850 | ||||||||||||||||
| Deposits |
59,646 | 55,129 | 47,516 | 45,468 | 38,559 | ||||||||||||||||
| Long-term
debt |
2,659 | 2,458 | 2,222 | 1,270 | 1,217 | ||||||||||||||||
| Shareholders’ equity |
6,367 | 6,159 | 5,747 | 4,787 | 3,845 | ||||||||||||||||
| Assets
under custody (in billions) |
$ | 10,121 | $ | 9,497 | $ | 9,370 | $ | 6,171 | $ | 6,203 | |||||||||||
| Assets
under management (in billions) |
1,441 | 1,354 | 1,106 | 763 | 775 | ||||||||||||||||
| Number
of employees |
20,965 | 19,668 | 19,850 | 19,501 | 19,753 | ||||||||||||||||
| RATIOS: |
|||||||||||||||||||||
| Continuing
operations: |
|||||||||||||||||||||
| Return
on shareholders’ equity |
15.3 | % | 13.3 | % | 13.9 | % | 24.1 | % | 17.3 | % | |||||||||||
| Return
on average assets |
.95 | .84 | .87 | 1.28 | .88 | ||||||||||||||||
| Dividend
payout |
25.3 | 26.9 | 25.9 | 15.4 | 21.0 | ||||||||||||||||
| Net
income: |
|||||||||||||||||||||
| Return
on shareholders’ equity |
13.6 | 13.3 | 13.9 | 24.1 | 17.3 | ||||||||||||||||
| Return
on average assets |
.84 | .84 | .87 | 1.28 | .88 | ||||||||||||||||
| Dividend
payout |
28.5 | 26.9 | 25.9 | 15.4 | 21.0 | ||||||||||||||||
| Average
shareholders’ equity to average assets |
6.2 | 6.3 | 6.3 | 5.3 | 5.1 | ||||||||||||||||
| Tier
1 risk-based capital |
11.7 | 13.3 | 14.0 | 17.1 | 13.6 | ||||||||||||||||
| Total
risk-based capital |
14.0 | 14.7 | 15.8 | 18.0 | 14.5 | ||||||||||||||||
| Tier
1 leverage ratio |
5.6 | 5.5 | 5.6 | 5.6 | 5.4 | ||||||||||||||||
| Tangible
common equity to adjusted total assets |
4.8 | 4.5 | 4.5 | 4.9 | 4.7 | ||||||||||||||||
ITEM 7. |
MANAGEMENT’S DISCUSSION AND ANALYSIS OF FINANCIAL CONDITION AND RESULTS OF OPERATIONS |
 |
||
| (1) | 2002
earnings per share included the gain on the sale of the divested Corporate
Trust business of $.90 per share. |
|
| (2) | 2003
earnings per share included the combined gains on sales of the divested
Corporate Trust and Private Asset Management businesses of $.68 per share,
and combined charges for divestiture costs, GSS acquisition merger and
integration costs, restructuring expenses, settlement of a state tax matter
and a loss on real estate sold equal to $.86 per share. |
|
| (3) | 2004
earnings per share included GSS merger and integration costs of $.12 per
share. |
|
 |
||
(1) |
2002 total
revenue included the gain on the sale of the divested Corporate Trust
business of $495 million. |
|
(2) |
2003
total revenue included the combined gains on sales of the divested Corporate
Trust and Private Asset Management businesses of $345 million and a
loss on real estate sold of $13 million. |
|
 |
|
|
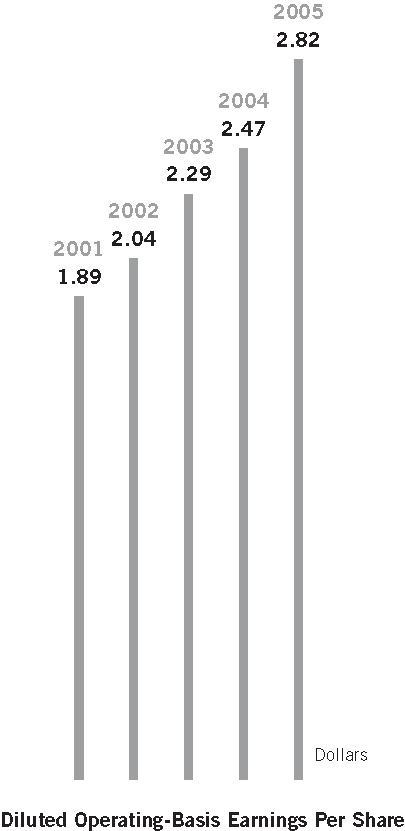
Significant
reconciling items between GAAP and operating-basis diluted earnings per
share are described in the footnotes to the chart on page 16. |
|
and commercial paper, to meet customers’ needs for high-grade liquid investments, and invest these sources of funds and additional borrowings in assets yielding a higher rate, generating net interest revenue.
| INDEX | |||||||||||||||||||||
|---|---|---|---|---|---|---|---|---|---|---|---|---|---|---|---|---|---|---|---|---|---|
| Daily
Averages of Indices |
Average
of Month-End Indices |
Year-End
Indices |
|||||||||||||||||||
| 2005 |
2004 |
Change |
2005 |
2004 |
Change |
2005 |
2004 |
Change |
|||||||||||||
| S&P
500® |
1207.2 | 1130.6 | 7 | % | 1207.8 | 1134.0 | 7 | % | 1248.3 | 1211.9 | 3 | % | |||||||||
| NASDAQ® |
2099.3 | 1986.5 | 6 | 2100.6 | 1992.9 | 5 | 2205.3 | 2175.4 | 1 | ||||||||||||
MSCI®
EAFE |
1536.2 | 1337.5 | 15 | 1540.0 | 1344.2 | 15 | 1680.1 | 1515.5 | 11 | ||||||||||||
| FEE REVENUE | ||||||||||||||||||
|---|---|---|---|---|---|---|---|---|---|---|---|---|---|---|---|---|---|---|
| 2005 |
2004 |
2003 |
Change 2004–2005 | |||||||||||||||
| (Dollars
in millions) |
||||||||||||||||||
| Years
ended December 31, |
||||||||||||||||||
| Servicing
fees |
$ | 2,474 | $ | 2,263 | $ | 1,950 | 9 | % | ||||||||||
| Management
fees |
751 | 623 | 533 | 21 | ||||||||||||||
| Trading
services |
694 | 595 | 529 | 17 | ||||||||||||||
| Securities
finance |
330 | 259 | 245 | 27 | ||||||||||||||
| Processing
fees and other |
302 | 308 | 299 | (2 | ) | |||||||||||||
| Total
fee revenue |
$ | 4,551 | $ | 4,048 | $ | 3,556 | 12 | |||||||||||
| ASSETS UNDER CUSTODY | ||||||||||||||||||||||||||||||
|---|---|---|---|---|---|---|---|---|---|---|---|---|---|---|---|---|---|---|---|---|---|---|---|---|---|---|---|---|---|---|
| 2005 |
2004 |
2003 | 2002 |
2001 | 2004–2005 AGR |
2000–2005 CAGR |
||||||||||||||||||||||||
| (Dollars
in billions) | ||||||||||||||||||||||||||||||
| As
of December 31, |
||||||||||||||||||||||||||||||
| Customers
in the U.S.: |
||||||||||||||||||||||||||||||
| Mutual
funds |
$ | 3,891 | $ | 3,385 | $ | 3,105 | $ | 2,719 | $ | 2,794 | 15 | % | 8 | % | ||||||||||||||||
| Pensions,
insurance and other investment pools |
4,136 | 4,093 | 3,198 | 2,734 | 2,737 | 1 | 8 | |||||||||||||||||||||||
| Customers
outside the U.S. |
2,094 | 2,019 | 988 | 718 | 672 | 4 | 26 | |||||||||||||||||||||||
| Acquired
with GSS(1) |
– | – | 2,079 | – | – | |||||||||||||||||||||||||
| Total |
$ | 10,121 | $ | 9,497 | $ | 9,370 | $ | 6,171 | $ | 6,203 | 7 | 11 | ||||||||||||||||||
| Non-U.S.
securities as a percentage of total |
23 | % | 22 | % | 12 | % | 14 | % | 13 | % | ||||||||||||||||||||
(1) |
Assets relating to GSS customers, the majority of which had not yet converted to our systems, at December 31, 2003. For 2005 and 2004, assets related to GSS customers were included in the other categories of assets. |
| MIX OF ASSETS UNDER CUSTODY | |||||||||||
|---|---|---|---|---|---|---|---|---|---|---|---|
| 2005 |
2004 |
2003 | |||||||||
| (Dollars
in billions) |
|||||||||||
| As
of December 31, |
|||||||||||
| Financial
Instrument Mix: |
|||||||||||
| Equities |
$ | 4,814 | $ | 4,688 | $ | 3,479 | |||||
| Fixed
income |
3,797 | 3,286 | 2,636 | ||||||||
| Short-term
and other investments |
1,510 | 1,523 | 1,176 | ||||||||
| Acquired
with GSS(1) |
– | – | 2,079 | ||||||||
| Total |
$ | 10,121 | $ | 9,497 | $ | 9,370 | |||||
(1) |
Assets relating to GSS customers, the majority of which had not yet converted to our systems, at December 31, 2003. For 2005 and 2004, assets related to GSS customers were included in the other categories of assets. |
| GEOGRAPHIC MIX OF ASSETS UNDER CUSTODY | |||||||||||
|---|---|---|---|---|---|---|---|---|---|---|---|
| 2005 |
2004 |
2003 | |||||||||
| (Dollars
in billions) |
|||||||||||
| As
of December 31, |
|||||||||||
| United
States |
$ | 7,951 | $ | 7,410 | $ | 7,506 | |||||
| Other
Americas |
330 | 324 | 255 | ||||||||
| Europe/Middle
East/Africa |
1,454 | 1,403 | 1,251 | ||||||||
| Asia/Pacific |
386 | 360 | 358 | ||||||||
| Total |
$ | 10,121 | $ | 9,497 | $ | 9,370 | |||||
methods for both U.S. and global equities and fixed income securities. SSgA also renewed its focus on exchange traded funds, or ETFs, launching new offerings such as the SPDR® Dividend ETFs, and saw growth in some of its innovative approaches such as the streetTRACKS® Gold Shares.
| ASSETS UNDER MANAGEMENT | ||||||||||||||||||||||||||||||
|---|---|---|---|---|---|---|---|---|---|---|---|---|---|---|---|---|---|---|---|---|---|---|---|---|---|---|---|---|---|---|
| 2005 |
2004 |
2003 |
2002 |
2001 |
2004–2005 AGR |
2000–2005 CAGR |
||||||||||||||||||||||||
| (Dollars
in billions) |
||||||||||||||||||||||||||||||
| As
of December 31, |
||||||||||||||||||||||||||||||
| Equities: |
||||||||||||||||||||||||||||||
| Passive |
$ | 602 | $ | 596 | $ | 522 | $ | 361 | $ | 398 | 1 | % | 11 | % | ||||||||||||||||
| Active |
172 | 131 | 78 | 44 | 39 | 31 | 31 | |||||||||||||||||||||||
| Employer
securities |
76 | 77 | 76 | 56 | 76 | (1 | ) | – | ||||||||||||||||||||||
| Fixed
income |
155 | 139 | 98 | 74 | 54 | 12 | 29 | |||||||||||||||||||||||
| Money
market |
436 | 411 | 332 | 228 | 208 | 6 | 19 | |||||||||||||||||||||||
| Total |
$ | 1,441 | $ | 1,354 | $ | 1,106 | $ | 763 | $ | 775 | 6 | 15 | ||||||||||||||||||
GEOGRAPHIC MIX OF ASSETS UNDER MANAGEMENT |
||||||||||||||
|---|---|---|---|---|---|---|---|---|---|---|---|---|---|---|
| (Dollars
in billions) |
2005 |
2004 |
2003 |
|||||||||||
| As
of December 31, |
||||||||||||||
| United
States |
$ | 1,023 | $ | 1,009 | $ | 891 | ||||||||
| Other
Americas |
24 | 23 | 15 | |||||||||||
| Europe/Middle
East/ Africa |
275 | 221 | 128 | |||||||||||
| Asia/Pacific |
119 | 101 | 72 | |||||||||||
| Total |
$ | 1,441 | $ | 1,354 | $ | 1,106 | ||||||||
ASSETS UNDER MANAGEMENT |
||||||||||||||
|---|---|---|---|---|---|---|---|---|---|---|---|---|---|---|
| (Dollars
in billions) |
2005 |
2004 |
2003 |
|||||||||||
|
Years
Ended December 31, |
||||||||||||||
|
Balance
at beginning of year |
$ | 1,354 | $ | 1,106 | $ | 763 | ||||||||
|
Net
new business |
36 | 145 | 179 | |||||||||||
|
Market
appreciation |
51 | 103 | 164 | |||||||||||
|
Balance
at end of year |
$ | 1,441 | $ | 1,354 | $ | 1,106 | ||||||||
| NET INTEREST REVENUE | ||||||||||||||||||
|---|---|---|---|---|---|---|---|---|---|---|---|---|---|---|---|---|---|---|
| 2005 |
2004 |
2003 |
Change 2004–2005 |
|||||||||||||||
| (Dollars
in millions) |
||||||||||||||||||
|
Years
ended December 31, |
||||||||||||||||||
|
Interest
revenue |
$ | 2,930 | $ | 1,787 | $ | 1,539 | 64 | % | ||||||||||
|
Interest
expense |
2,023 | 928 | 729 | 118 | ||||||||||||||
|
Net
interest revenue |
907 | 859 | 810 | 6 | ||||||||||||||
|
Provision
for loan losses |
– | (18 | ) | – | ||||||||||||||
|
Net
interest revenue after provision for loan losses |
$ | 907 | $ | 877 | $ | 810 | ||||||||||||
|
Net
interest revenue (taxable-equivalent basis) |
$ | 949 | $ | 904 | $ | 861 | 5 | % | ||||||||||
|
Excess
of rates earned over rates paid (taxable-equivalent basis) |
.82 | % | .95 | % | 1.04 | % | ||||||||||||
|
Net
interest margin (taxable-equivalent basis) |
1.08 | 1.08 | 1.17 | |||||||||||||||
| OPERATING EXPENSES | ||||||||||||||||
|---|---|---|---|---|---|---|---|---|---|---|---|---|---|---|---|---|
| 2005 |
2004 |
2003 |
Change 2004–2005 |
|||||||||||||
| (Dollars in millions) | ||||||||||||||||
|
Years
Ended December 31, |
||||||||||||||||
|
Salaries
and employee benefits |
$ | 2,231 | $ | 1,957 | $ | 1,731 | 14 | % | ||||||||
|
Information
systems and communications |
486 | 527 | 551 | (8 | ) | |||||||||||
|
Transaction
processing services |
449 | 398 | 314 | 13 | ||||||||||||
|
Occupancy |
391 | 363 | 300 | 8 | ||||||||||||
|
Merger,
integration and divestiture |
– | 62 | 110 | (100 | ) | |||||||||||
|
Restructuring |
– | 21 | 296 | (100 | ) | |||||||||||
|
Other |
484 | 431 | 320 | 12 | ||||||||||||
|
Total
operating expenses |
$ | 4,041 | $ | 3,759 | $ | 3,622 | 8 | |||||||||
|
Number
of employees at year-end |
20,965 | 19,668 | 19,850 | |||||||||||||
Investment Servicing |
Investment
Management |
Business
Divestiture |
Other/One-Time |
Total |
||||||||||||||||||||||||||||||||||||||||||||||||||||||||
|---|---|---|---|---|---|---|---|---|---|---|---|---|---|---|---|---|---|---|---|---|---|---|---|---|---|---|---|---|---|---|---|---|---|---|---|---|---|---|---|---|---|---|---|---|---|---|---|---|---|---|---|---|---|---|---|---|---|---|---|---|
| 2005 |
2004 |
2003 |
2005 |
2004 |
2003 |
2005 |
2004 |
2003 |
2005 |
2004 |
2003 |
2005 |
2004 |
2003 |
||||||||||||||||||||||||||||||||||||||||||||||
| (Dollars
in millions, unless otherwise noted) |
||||||||||||||||||||||||||||||||||||||||||||||||||||||||||||
| Years ended December 31, | ||||||||||||||||||||||||||||||||||||||||||||||||||||||||||||
| Fee
revenue: |
||||||||||||||||||||||||||||||||||||||||||||||||||||||||||||
| Servicing
fees |
$ | 2,474 | $ | 2,263 | $ | 1,950 | $ | 2,474 | $ | 2,263 | $ | 1,950 | ||||||||||||||||||||||||||||||||||||||||||||||||
Management
fees |
– | – | – | $ | 751 | $ | 623 | $ | 474 | $ | 59 | 751 | 623 | 533 | ||||||||||||||||||||||||||||||||||||||||||||||
Trading
services |
694 | 595 | 529 | – | – | – | – | 694 | 595 | 529 | ||||||||||||||||||||||||||||||||||||||||||||||||||
Securities
finance |
260 | 211 | 206 | 70 | 48 | 39 | – | 330 | 259 | 245 | ||||||||||||||||||||||||||||||||||||||||||||||||||
Processing
fees and other |
221 | 239 | 277 | 81 | 69 | 34 | 1 | $ | (13 | ) | 302 | 308 | 299 | |||||||||||||||||||||||||||||||||||||||||||||||
Total
fee revenue |
3,649 | 3,308 | 2,962 | 902 | 740 | 547 | 60 | (13 | ) | 4,551 | 4,048 | 3,556 | ||||||||||||||||||||||||||||||||||||||||||||||||
Net
interest revenue |
826 | 816 | 773 | 81 | 43 | 37 | – | – | 907 | 859 | 810 | |||||||||||||||||||||||||||||||||||||||||||||||||
Provision
for loan losses |
– | (18 | ) | – | – | – | – | – | – | – | (18 | ) | – | |||||||||||||||||||||||||||||||||||||||||||||||
Net
interest revenue after provision for loan losses |
826 | 834 | 773 | 81 | 43 | 37 | – | – | 907 | 877 | 810 | |||||||||||||||||||||||||||||||||||||||||||||||||
(Losses)
gains on sales of available-for-sale investment securities, net |
(1 | ) | 26 | 23 | – | – | – | – | – | (1 | ) | 26 | 23 | |||||||||||||||||||||||||||||||||||||||||||||||
Gains
on sales of divested businesses, net |
– | – | – | – | – | – | – | $ | 16 | 345 | 16 | – | 345 | |||||||||||||||||||||||||||||||||||||||||||||||
Total
revenue |
4,474 | 4,168 | 3,758 | 983 | 783 | 584 | 60 | 16 | 332 | 5,473 | 4,951 | 4,734 | ||||||||||||||||||||||||||||||||||||||||||||||||
Operating
expenses |
3,363 | 3,115 | 2,706 | 678 | 582 | 473 | 37 | – | $ | 62 | 406 | 4,041 | 3,759 | 3,622 | ||||||||||||||||||||||||||||||||||||||||||||||
Income
from continuing operations before income taxes |
$ | 1,111 | $ | 1,053 | $ | 1,052 | $ | 305 | $ | 201 | $ | 111 | $ | 23 | $ | 16 | $ | (62 | ) | $ | (74 | ) | $ | 1,432 | $ | 1,192 | $ | 1,112 | ||||||||||||||||||||||||||||||||
Pre-tax
margin |
25 | % | 25 | % | 28 | % | 31 | % | 26 | % | 19 | % | ||||||||||||||||||||||||||||||||||||||||||||||||
Average
assets (in billions) |
$ | 96.9 | $ | 92.5 | $ | 80.6 | $ | 2.9 | $ | 2.6 | $ | 2.0 | $ | .1 | $ | 99.8 | $ | 95.1 | $ | 82.7 | ||||||||||||||||||||||||||||||||||||||||
OVERVIEW OF RESULTS OF OPERATIONS |
|||||||||||||||||||
|---|---|---|---|---|---|---|---|---|---|---|---|---|---|---|---|---|---|---|---|
| 2004 |
2003 |
$
Change |
%
Change |
||||||||||||||||
| (Dollars
in millions, except per share data) |
|||||||||||||||||||
| Years
ended December 31, |
|||||||||||||||||||
| Total
fee revenue |
$ | 4,048 | $ | 3,556 | $ | 492 | 14 | % | |||||||||||
| Net
interest revenue |
859 | 810 | 49 | 6 | |||||||||||||||
| Provision
for loan losses |
(18 | ) | – | (18 | ) | – | |||||||||||||
| Gains
on sales of available-for-sale investment securities, net |
26 | 23 | 3 | 13 | |||||||||||||||
| Gains
on sales of divested businesses |
– | 345 | (345 | ) | (100 | ) | |||||||||||||
| Total
revenue |
4,951 | 4,734 | 217 | 5 | |||||||||||||||
| Total
operating expenses |
3,759 | 3,622 | 137 | 4 | |||||||||||||||
| Income
before income tax expense |
1,192 | 1,112 | 80 | 7 | |||||||||||||||
| Income
tax expense |
394 | 390 | 4 | ||||||||||||||||
| Net
income |
$ | 798 | $ | 722 | $ | 76 | 11 | ||||||||||||
| Earnings
Per Share: |
|||||||||||||||||||
| Basic |
$ | 2.38 | $ | 2.18 | $ | .20 | 9 | ||||||||||||
| Diluted |
2.35 | 2.15 | .20 | 9 | |||||||||||||||
| Return
on shareholders’ equity |
13.3 | % | 13.9 | % | |||||||||||||||
| TOTAL REVENUE |
||||||||||||||||||
|---|---|---|---|---|---|---|---|---|---|---|---|---|---|---|---|---|---|---|
| 2004 |
2003 |
$
Change |
%
Change |
|||||||||||||||
| (Dollars
in millions) |
||||||||||||||||||
| Years
ended December 31, |
||||||||||||||||||
| Fee
Revenue: |
||||||||||||||||||
| Servicing
fees |
$ | 2,263 | $ | 1,950 | $ | 313 | 16 | % | ||||||||||
| Management
fees |
623 | 533 | 90 | 17 | ||||||||||||||
| Trading
services |
595 | 529 | 66 | 12 | ||||||||||||||
| Securities
finance |
259 | 245 | 14 | 6 | ||||||||||||||
| Processing
fees and other |
308 | 299 | 9 | 3 | ||||||||||||||
| Total
fee revenue |
4,048 | 3,556 | 492 | 14 | ||||||||||||||
| Net
Interest Revenue: |
||||||||||||||||||
| Interest
revenue |
1,787 | 1,539 | 248 | 16 | ||||||||||||||
| Interest
expense |
928 | 729 | 199 | 27 | ||||||||||||||
| Net
interest revenue |
859 | 810 | 49 | 6 | ||||||||||||||
| Provision
for loan losses |
(18 | ) | – | (18 | ) | |||||||||||||
| Net
interest revenue after provision for loan losses |
877 | 810 | 67 | 8 | ||||||||||||||
| Gains
on sales of available-for-sale investment securities, net |
26 | 23 | 3 | 13 | ||||||||||||||
| Gain
on sale of Private Asset Management business, net of exit and other associated costs |
– | 285 | (285 | ) | (100 | ) | ||||||||||||
| Gain
on sale of Corporate Trust business |
– | 60 | (60 | ) | (100 | ) | ||||||||||||
| Total
revenue |
$ | 4,951 | $ | 4,734 | $ | 217 | 5 | |||||||||||
| OPERATING EXPENSES |
||||||||||||||||||
|---|---|---|---|---|---|---|---|---|---|---|---|---|---|---|---|---|---|---|
| 2004 |
2003 |
$
Change |
%
Change |
|||||||||||||||
| (Dollars
in millions) |
||||||||||||||||||
| Years
ended December 31, |
||||||||||||||||||
| Operating
Expenses: |
||||||||||||||||||
| Salaries
and employee benefits |
$ | 1,957 | $ | 1,731 | $ | 226 | 13 | % | ||||||||||
| Information
systems and communications |
527 | 551 | (24 | ) | (4 | ) | ||||||||||||
| Transaction
processing services |
398 | 314 | 84 | 27 | ||||||||||||||
| Occupancy |
363 | 300 | 63 | 21 | ||||||||||||||
| Merger,
integration and divestiture costs |
62 | 110 | (48 | ) | (44 | ) | ||||||||||||
| Restructuring
costs |
21 | 296 | (275 | ) | (93 | ) | ||||||||||||
| Other |
431 | 320 | 111 | 35 | ||||||||||||||
| Total
operating expenses |
$ | 3,759 | $ | 3,622 | $ | 137 | 4 | |||||||||||
income. Unearned income is recognized in interest revenue to yield a level rate of return on the net investment in the leases.
adjudicated by the court systems of the various tax jurisdictions or may be settled with the taxing authority upon examination or administrative appeal.
 |
|
 |
| 2005 | 2004 | |||||||||
|---|---|---|---|---|---|---|---|---|---|---|
AAA(1) |
|
90 |
% |
|
93 |
% |
||||
AA |
5 |
2 |
||||||||
A |
3 |
3 |
||||||||
BBB |
1 |
1 |
||||||||
Non-rated |
1 |
1 |
||||||||
| |
100 |
% |
100 |
% |
||||||
(1) |
Includes U.S. Treasury securities |
| (Dollars in millions) |
2005 |
2004 |
2003 |
|||||||||||
|---|---|---|---|---|---|---|---|---|---|---|---|---|---|---|
| Available
for Sale: |
||||||||||||||
| U.S.
Treasury and federal agencies: |
||||||||||||||
| Direct
obligations |
$ | 10,214 | $ | 12,119 | $ | 18,986 | ||||||||
| Mortgage-backed securities |
11,138 | 9,147 | 3,762 | |||||||||||
| Asset-backed
securities |
23,842 | 10,056 | 9,885 | |||||||||||
| State
and political subdivisions |
1,868 | 1,785 | 1,999 | |||||||||||
| Collateralized
mortgage obligations |
5,527 | 1,719 | 1,333 | |||||||||||
| Other
debt investments |
1,695 | 922 | 310 | |||||||||||
| Money-market
mutual funds |
232 | 97 | 85 | |||||||||||
| Other
equity securities |
463 | 326 | 238 | |||||||||||
| Total |
$ | 54,979 | $ | 36,171 | $ | 36,598 | ||||||||
| Held
to Maturity: |
||||||||||||||
| U.S.
Treasury and federal agencies |
||||||||||||||
| Direct
obligations |
$ | 1,657 | $ | 1,294 | $ | 1,345 | ||||||||
| Mortgage-backed securities |
925 | – | – | |||||||||||
| Collateralized
mortgage obligations |
2,086 | – | – | |||||||||||
| Other
investments |
223 | 106 | 272 | |||||||||||
| Total |
$ | 4,891 | $ | 1,400 | $ | 1,617 | ||||||||
accounting standards do not allow for the change in economic value of our customer liabilities to offset unrealized losses on available-for-sale securities.
| Under
1 Year |
1
to 5 Years |
6
to 10 Years |
Over
10 Years |
|||||||||||||||||||||||||||||
|---|---|---|---|---|---|---|---|---|---|---|---|---|---|---|---|---|---|---|---|---|---|---|---|---|---|---|---|---|---|---|---|---|
| Amount |
Yield |
Amount |
Yield |
Amount |
Yield |
Amount |
Yield |
|||||||||||||||||||||||||
| (Dollars
in millions) |
||||||||||||||||||||||||||||||||
| Available
for Sale: |
||||||||||||||||||||||||||||||||
| U.S.
Treasury and federal agencies |
||||||||||||||||||||||||||||||||
Direct
obligations |
$ | 2,614 | 2.32 | % | $ | 7,103 | 3.75 | % | $ | 497 | 4.22 | % | ||||||||||||||||||||
Mortgage-backed securities |
40 | 3.49 | 1,107 | 3.76 | 5,154 | 4.34 | $ | 4,837 | 4.75 | % | ||||||||||||||||||||||
Asset-backed
securities |
1,818 | 3.92 | 9,373 | 4.36 | 9,309 | 4.59 | 3,342 | 4.40 | ||||||||||||||||||||||||
State
and political subdivisions(1) |
321 | 3.56 | 783 | 4.93 | 627 | 4.60 | 137 | 4.34 | ||||||||||||||||||||||||
Collateralized
mortgage obligations |
97 | 3.60 | 1,948 | 4.32 | 2,404 | 4.89 | 1,078 | 4.99 | ||||||||||||||||||||||||
Other
investments |
685 | 3.24 | 613 | 4.64 | 389 | 4.99 | 8 | 5.86 | ||||||||||||||||||||||||
Total |
$ | 5,575 | $ | 20,927 | $ | 18,380 | $ | 9,402 | ||||||||||||||||||||||||
Held
to Maturity: |
||||||||||||||||||||||||||||||||
U.S.
Treasury and federal agencies |
||||||||||||||||||||||||||||||||
Direct
obligations |
$ | 856 | 2.30 | % | $ | 801 | 4.12 | % | ||||||||||||||||||||||||
Mortgage-backed securities |
— | — | — | — | $ | 226 | 4.70 | % | $ | 699 | 5.04 | % | ||||||||||||||||||||
Collateralized
mortgage obligations |
— | — | 354 | 4.61 | 1,007 | 4.99 | 725 | 4.97 | ||||||||||||||||||||||||
Other
investments |
73 | 2.29 | 65 | 2.69 | 81 | 3.42 | 4 | 3.16 | ||||||||||||||||||||||||
Total |
$ | 929 | $ | 1,220 | $ | 1,314 | $ | 1,428 | ||||||||||||||||||||||||
(1) |
Yields calculated for interest revenue on non-taxable investment securities include the effect of taxable-equivalent adjustments, a method of presentation in which interest income on tax-exempt securities is adjusted to present the earnings performance on a basis equivalent to interest earned on fully taxable securities, with a corresponding charge to income tax expense. The adjustment is computed using a federal income tax rate of 35%, adjusted for applicable state income taxes, net of the related federal tax benefit. The taxable-equivalent adjustment included in interest revenue to calculate the yields above was $42 million for the year ended December 31, 2005. |
| 2005 |
2004 |
2003 |
2002 |
2001 |
||||||||||||||||||
|---|---|---|---|---|---|---|---|---|---|---|---|---|---|---|---|---|---|---|---|---|---|---|
| (Dollars
in millions) |
||||||||||||||||||||||
| U.S.: |
||||||||||||||||||||||
| Commercial
and financial |
$ | 2,298 | $ | 1,826 | $ | 2,344 | $ | 1,578 | $ | 2,479 | ||||||||||||
| Lease
financing |
404 | 373 | 395 | 403 | 413 | |||||||||||||||||
| Total
U.S. |
2,702 | 2,199 | 2,739 | 1,981 | 2,892 | |||||||||||||||||
| Non-U.S.: |
||||||||||||||||||||||
| Commercial
and industrial |
1,854 | 526 | 424 | 289 | 725 | |||||||||||||||||
| Lease
financing |
1,926 | 1,904 | 1,858 | 1,719 | 1,639 | |||||||||||||||||
| Banks
and other financial institutions |
– | – | – | 177 | 71 | |||||||||||||||||
| Other |
– | – | – | 8 | 14 | |||||||||||||||||
| Total
non-U.S. |
3,780 | 2,430 | 2,282 | 2,193 | 2,449 | |||||||||||||||||
| Total
loans |
$ | 6,482 | $ | 4,629 | $ | 5,021 | $ | 4,174 | $ | 5,341 | ||||||||||||
| Average
loans and lease financing outstanding |
$ | 6,013 | $ | 5,689 | $ | 5,568 | $ | 5,105 | $ | 6,081 | ||||||||||||
| YEARS |
||||||||||||||||||
|---|---|---|---|---|---|---|---|---|---|---|---|---|---|---|---|---|---|---|
| Total |
Under
1 |
1
to 5 |
Over
5 |
|||||||||||||||
| (Dollars
in millions) |
||||||||||||||||||
| U.S.: |
||||||||||||||||||
| Commercial
and financial |
$ | 2,298 | $ | 2,257 | $ | 34 | $ | 7 | ||||||||||
| Lease
financing |
404 | 4 | 59 | 341 | ||||||||||||||
| Total
U.S. |
2,702 | 2,261 | 93 | 348 | ||||||||||||||
| Non-U.S.: |
||||||||||||||||||
| Commercial
and industrial |
1,854 | 1,853 | 1 | – | ||||||||||||||
| Lease
financing |
1,926 | – | 460 | 1,466 | ||||||||||||||
| Total
non-U.S. |
3,780 | 1,853 | 461 | 1,466 | ||||||||||||||
| Total |
$ | 6,482 | $ | 4,114 | $ | 554 | $ | 1,814 | ||||||||||
| (Dollars in millions) |
||||||
|---|---|---|---|---|---|---|
| Loans
and leases with predetermined interest rates |
$ | 2,327 | ||||
| Loans
and leases with floating or adjustable interest rates |
41 | |||||
| Total |
$ | 2,368 | ||||
| 2005 |
2004 |
2003 |
||||||||||||
|---|---|---|---|---|---|---|---|---|---|---|---|---|---|---|
| (Dollars
in millions) |
||||||||||||||
| Germany |
$ | 4,217 | $ | 3,971 | $ | 3,834 | ||||||||
| United
Kingdom |
2,696 | 2,355 | 4,243 | |||||||||||
| Canada |
1,463 | 1,383 | 1,175 | |||||||||||
| Australia |
1,441 | 1,760 | 1,528 | |||||||||||
| Netherlands |
992 | – | – | |||||||||||
| Japan |
– | 941 | 1,490 | |||||||||||
| France |
– | – | 1,346 | |||||||||||
| Total
outstanding |
$ | 10,809 | $ | 10,410 | $ | 13,616 | ||||||||
requirements and the evaluations of the major independent credit rating agencies that assign ratings to our public debt.
| REGULATORY GUIDELINES |
STATE
STREET |
STATE
STREET BANK |
||||||||||||||||||||||
|---|---|---|---|---|---|---|---|---|---|---|---|---|---|---|---|---|---|---|---|---|---|---|---|---|
| Minimum |
Well Capitalized |
2005 |
2004 |
2005 |
2004 |
|||||||||||||||||||
| Regulatory
Capital Ratios: |
||||||||||||||||||||||||
| Tier
1 capital |
4 | % | 6 | % | 11.7 | % | 13.3 | % | 10.3 | % | 11.6 | % | ||||||||||||
| Total
capital |
8 | 10 | 14.0 | 14.7 | 12.5 | 12.5 | ||||||||||||||||||
| Tier
1 leverage ratio(1) |
4 | 5 | 5.6 | 5.5 | 5.4 | 5.3 | ||||||||||||||||||
(1) |
Regulatory guideline for well-capitalized applies only to State Street Bank. |
 |
|
We have increased our quarterly dividend twice each year since 1978. Over the last ten years, dividends per share have grown at a 16% compound annual growth rate. Funds for cash distributions to our shareholders by the parent company are derived from a variety of sources. The level of dividends paid to shareholders on our common stock, which was $239 million in 2005, is reviewed regularly and determined by the Board considering our liquidity, capital adequacy and recent earnings history and prospects, as well as economic conditions and other factors deemed relevant. Federal and state banking regulations place certain restrictions on dividends paid by subsidiary banks to the parent holding company. In addition, bank regulators have the authority to prohibit bank holding companies from paying dividends if they deem such payment to be an unsafe or unsound practice. At December 31, 2005, the parent company had $9.63 billion of liquid assets with which to meet dividend declaration and other payment obligations. Information concerning dividends from our subsidiary banks is in Note 13 of the “Notes to Consolidated Financial Statements” included in this Form 10-K under Item 8.
• |
Market risk: the risk of adverse financial impact due to fluctuations in market prices, primarily as they relate to our trading activities |
• |
Interest-rate risk: the risk of loss in non-trading, asset and liability management positions, primarily the impact of adverse movements in interest rates on the repricing mismatches that exist between balance sheet assets and liabilities |
• |
Credit risk: the risk of loss that may result from the default or downgrade of a borrower or counterparty |
• |
Operational risk: the risk of loss from inadequate or failed internal processes, people and systems, or from external events, which is consistent with the Basel II definition |
• |
Business risk: the risk of adverse changes in our earnings from business factors, including changes in the competitive environment, changes in the operational economics of business activities, and the effect of strategic and reputation risks |
| Standard & Poor’s |
Moody’s |
Fitch |
DBRS |
|||||||||||
|---|---|---|---|---|---|---|---|---|---|---|---|---|---|---|
| State Street Corporation: | ||||||||||||||
| Short-term
commercial paper |
A-1 | + | P-1 | F1 | + | R-1 | (mid) | |||||||
| Senior
debt |
AA | – | Aa3 | AA | – | AA | (low) | |||||||
| Subordinated
debt |
A | + | A1 | A | + | A | (high) | |||||||
| Capital
securities |
A | A1 | A | + | A | (high) | ||||||||
| State
Street Bank: |
||||||||||||||
| Short-term
deposits |
A-1 | + | P-1 | F1 | + | R-1 | (mid) | |||||||
| Long-term
deposits |
AA | Aa2 | AA | AA | ||||||||||
| Senior
debt |
AA | – | Aa2 | AA | – | AA | ||||||||
| Subordinated
debt |
AA | – | Aa3 | A | + | AA | (low) | |||||||
| Outlook |
Stable | Stable | Stable | Stable | ||||||||||
| CONTRACTUAL CASH OBLIGATIONS |
|||||||||||||||
|---|---|---|---|---|---|---|---|---|---|---|---|---|---|---|---|
| PAYMENTS
DUE BY PERIOD |
|||||||||||||||
| Total |
Less
than 1 year |
1–3
years |
4–5 years |
Over
5 years |
|||||||||||
| (Dollars
in millions) |
|||||||||||||||
| As
of December 31, 2005 |
|||||||||||||||
| Long-term
debt(1) |
$ | 4,083 | $ | 138 | $ | 276 | $ | 558 | $ | 3,111 | |||||
| Operating
leases |
1,167 | 180 | 292 | 227 | 468 | ||||||||||
| Capital
lease obligations |
925 | 51 | 103 | 104 | 667 | ||||||||||
| COVERS,
a component of SPACES |
2 | 2 | – | – | – | ||||||||||
| Total
contractual cash obligations |
$ | 6,177 | $ | 371 | $ | 671 | $ | 889 | $ | 4,246 | |||||
(1) |
Long-term debt above excludes capital leases (reported as a separate line item) and the effect of interest-rate swaps. Interest payments were calculated at the stated rate, with the exception of floating-rate debt for which payments were calculated using the indexed rate in effect at December 31, 2005. |
under Item 8. We have obligations under pension and other postretirement benefit plans, which are more fully described in Note 17 of the “Notes to Consolidated Financial Statements,” which are not included in the above table.
| OTHER COMMERCIAL COMMITMENTS |
|||||||||||||||||
|---|---|---|---|---|---|---|---|---|---|---|---|---|---|---|---|---|---|
| TENURE
OF COMMITMENT |
|||||||||||||||||
| Total amounts committed(1) |
Less
than 1 year |
1–3 years |
4–5 years |
Over
5 years |
|||||||||||||
| (Dollars
in millions) |
|||||||||||||||||
| As
of December 31, 2005 |
|||||||||||||||||
| Indemnified
securities financing |
$ | 372,863 | $ | 372,863 | |||||||||||||
| Liquidity
asset purchase agreements |
24,039 | 19,956 | $ | 2,200 | $ | 1,402 | $ | 481 | |||||||||
| Unfunded
commitments to extend credit |
14,403 | 11,887 | 602 | 1,824 | 90 | ||||||||||||
| Standby
letters of credit |
4,689 | 1,249 | 1,595 | 1,259 | 586 | ||||||||||||
| Total
commercial commitments |
$ | 415,994 | $ | 405,955 | $ | 4,397 | $ | 4,485 | $ | 1,157 | |||||||
(1) |
Amounts committed are reported net of participations. |
Street. Chaired by the head of ERM, the MRC focuses on the review of business activities with significant risk content and the assessment of risk management programs and initiatives, and also serves as the credit policy committee for State Street. The Capital Committee, chaired by the Chief Financial Officer, oversees the management of our regulatory and economic capital, the determination of the framework for capital allocation and strategies for capital structure and debt and equity issuances. ALCO, chaired by the Treasurer, oversees the management of our consolidated balance sheet, including management of our global liquidity and interest-rate risk positions. The Fiduciary Committee reviews the criteria for the acceptance of fiduciary duties, and assists our business lines with their fiduciary responsibilities executed on behalf of customers. Several other committees with specialized risk management functions report to the MRC.
| VALUE-AT-RISK |
||||||||||||||
|---|---|---|---|---|---|---|---|---|---|---|---|---|---|---|
| Annual Average |
Maximum |
Minimum |
||||||||||||
| (Dollars
in millions) |
||||||||||||||
| Years
ended December 31, |
||||||||||||||
| 2005: |
||||||||||||||
| Foreign
exchange products |
$ | 1.3 | $ | 3.3 | $ | .5 | ||||||||
| Interest-rate
products |
1.1 | 3.0 | .3 | |||||||||||
| 2004: |
||||||||||||||
| Foreign
exchange products |
$ | 1.3 | $ | 3.5 | $ | .3 | ||||||||
| Interest-rate
products |
1.6 | 3.0 | 1.0 | |||||||||||
NIR-AT-RISK |
Estimated
Exposure to Net Interest Revenue |
|||||||||
|---|---|---|---|---|---|---|---|---|---|---|
| 2005 |
2004 |
|||||||||
| (Dollars
in millions) Rate Change |
||||||||||
+
100 bps shock |
$ | (58 | ) | $ | (49 | ) | ||||
–
100 bps shock |
(5 | ) | 3 | |||||||
+
100 bps ramp |
(35 | ) | (39 | ) | ||||||
–
100 bps ramp |
9 | 18 | ||||||||
| ECONOMIC VALUE OF EQUITY |
Estimated
Exposure to Economic Value of Equity |
|||||||||
|---|---|---|---|---|---|---|---|---|---|---|
| 2005 |
2004 |
|||||||||
| (Dollars
in millions) Rate Change |
||||||||||
+
200 bps shock |
$ | (714 | ) | $ | (775 | ) | ||||
–
200 bps shock |
138 | 467 | ||||||||
| 2005 |
2004 |
2003 |
2002 |
2001 |
||||||||||||||||||
|---|---|---|---|---|---|---|---|---|---|---|---|---|---|---|---|---|---|---|---|---|---|---|
| (Dollars
in millions) |
||||||||||||||||||||||
| U.S.: |
||||||||||||||||||||||
| Balance
at beginning of year |
$ | 14 | $ | 43 | $ | 43 | $ | 40 | $ | 41 | ||||||||||||
| Provision
for loan losses |
– | (15 | ) | – | 4 | 8 | ||||||||||||||||
| Loan
charge-offs — commercial and financial |
– | – | – | (3 | ) | (9 | ) | |||||||||||||||
| Recoveries
— commercial and financial |
– | – | – | 3 | – | |||||||||||||||||
| Transferred
upon sale(1) |
– | – | – | (1 | ) | – | ||||||||||||||||
| Reclassification(2) |
– | (14 | ) | – | – | – | ||||||||||||||||
| Balance
at end of year — U.S. |
14 | 14 | 43 | 43 | 40 | |||||||||||||||||
| Non-U.S.: |
||||||||||||||||||||||
| Balance
at beginning of year |
4 | 18 | 18 | 18 | 16 | |||||||||||||||||
| Provision
for loan losses |
– | (3 | ) | – | – | 2 | ||||||||||||||||
| Loan
charge-offs |
– | – | – | – | – | |||||||||||||||||
| Reclassification(2) |
– | (11 | ) | – | – | – | ||||||||||||||||
| Balance
at end of year — Non-U.S. |
4 | 4 | 18 | 18 | 18 | |||||||||||||||||
| Total
balance at end of year |
$ | 18 | $ | 18 | $ | 61 | $ | 61 | $ | 58 | ||||||||||||
| Ratio
of net charge-offs (recoveries) to average loans outstanding |
– | – | – | – | .14 | % | ||||||||||||||||
(1) |
In December 2002, we completed the sale of our Global Trade Banking business, which included the transfer of $1 million of the allowance for loan losses. |
(2) |
During 2004, we reclassified $25 million of the allowance for loan losses to other liabilities as a reserve for off-balance sheet commitments. Subsequent to the reclassification, the reserve for off-balance sheet commitments was reduced by $10 million, and recorded as an offset to other operating expenses. |
of the fair market value of the securities borrowed. The borrowed securities are revalued daily to determine if additional collateral is necessary. State Street held, as agent, cash and U.S. government securities totaling $387.22 billion and $360.61 billion as collateral for indemnified securities financing at December 31, 2005 and 2004, respectively.
analysis, stress-testing and management judgment to help assess the potential effect on State Street attributable to business risk. Management and control of business risks is generally the responsibility of the business units as part of their overall and strategic planning and internal risk management processes.
TO OUR SHAREHOLDERS
State Street delivered value in 2005.
We delivered value to our shareholders, our customers, our employees and the communities in which we operate. We achieved this value by focusing on delivering for our customers, executing our plan against our goals, performing consistently for our shareholders, providing more opportunities for our employees, and continuing to give back to the communities where we do business.
Our goals for 2005 included growth in operating earnings per share of between 10 and 15 percent, growth in operating revenue of between 8 and 12 percent, and operating return on shareholders’ equity of between 14 and 17 percent. We achieved these goals, increasing operating earnings per share from continuing operations by 14 percent and operating revenue by 10 percent and recording return on shareholders’ equity from continuing operations of 15.3 percent. Assets under custody hit an all-time high of $10.1 trillion and assets under management rose to a record $1.4 trillion.
2005 was our 28th consecutive year of operating earnings per share growth and our 27th consecutive year of dividend increases, which rose 12 percent. We also repurchased 13 million shares of our stock, putting our share count at 334 million shares outstanding, just as it was at the end of 2004.
I measure the year’s achievements in four ways.
Financial
We remained focused on the bottom line in 2005, carefully balancing revenue growth with continued expense management. This focus allowed us to generate positive operating leverage for the year, an objective I set out to accomplish when I took over as chairman and chief executive officer in July 2004, and one that I continue to target. I view our 2005 results as a start, and an indication that we are heading in the right direction.
Business growth across the company helped fuel our revenue increase in 2005. We added more than 2,000 new investment servicing and investment management wins in 2005, a result of our strong sales culture and our ability to execute. State Street Global Advisors (SSgA), our investment management arm and the largest institutional asset manager in the world, also posted significant growth in 2005 and improved its contribution to State Street overall. SSgA now represents 21 percent of State Street’s total pretax income, up from 17 percent a year ago.
We continued to deepen existing customer relationships and expand new product capabilities. These factors, combined with new business growth, enabled us to deliver what I consider to be better top-line performance than our peers.
We continue to see significant opportunities for growth outside of the United States, which accounted for 39 percent of State Street’s revenue in 2005, up from 37 percent at the end of 2004. I have set a goal of increasing this number to 50 percent over time, fueled in part by the growth of savings and retirement assets in Europe and the Asia-Pacific region and the globalization of investing.
In addition to revenue growth, positive operating leverage was achieved through expense control. By monitoring our headcount, adding mainly to support new business wins and by better aligning our real estate portfolio with our needs, we slowed our rate of expense growth. Our strengthened and more cost-effective global servicing model, shaped in part by new regulatory requirements, helped us to better serve our customers in the locations where they do business. We now have processing hubs in multiple locations around the world including Canada and India.
The centralized treasury group that we formed early in 2005 has improved management of our balance sheet, which is driven by customer liabilities. To better position State Street for rising interest rates, in 2005 we expanded the investment portfolio and adjusted the mix of investments to include higher yielding floating-rate securities, ending the year with a conservatively invested portfolio, 95 percent of which was AA rated or better.
Customer
State Street’s singular focus on providing large, global institutional investors with unparalleled service and value remained a differentiator for our company in 2005. Our ability to handle complex transactions, create innovative solutions and improve efficiencies helped us to attract new customers and add significant value to our existing customer relationships around the world.
|
2,086 |
14% |
|
new investment servicing and |
growth in operating earnings per share |
|
investment management wins |
from continuing operations |
Major wins that fell into the expanded business category in 2005 included a landmark investment manager operations outsourcing renewal from Scottish Widows Investment Partnership in Edinburgh, extending our relationship with this customer well into a second decade. The year’s biggest investment servicing win, from Columbia Management Advisors, LLC, the asset management arm of Bank of America, gave State Street a key role in one of the largest fund integrations in the history of the mutual fund industry. This piece of business expands upon our existing relationship with a fund family that was acquired by Bank of America and illustrates our ability to earn the trust and confidence of our customers, as does another investment servicing appointment from Charles Schwab Investment Management for $149 billion in assets. Two wins from Volkswagen Group – one in the United Kingdom and the other in Germany – are further proof of our ability to expand many of the custody and accounting relationships we established years ago.
We also established many new customer relationships in 2005 in all major geographies and across all our capabilities. These relationships include conducting one of the largest-ever transition management assignments for a customer in Japan and providing servicing and management for a wide range of pension and investment schemes in Europe and Asia-Pacific. State Street’s ability to develop new products and services for both new and existing customers continues to set us apart.
State Street Global Advisors played an important role during the year in helping to enhance Asia’s bond markets as manager of the ABF Pan Asia Bond Index Fund, a key component of the Asian Bond Fund 2, an initiative developed by a group of 11 central banks and monetary authorities designed to provide governments with an additional source of credit. The fund invests in the local currency debt of eight countries in Asia, increasing investors access to this vital region of the world.
|
10% |
28 |
|
increase in operating revenue |
consecutive years of growth in |
|
|
operating earnings per share |
Product innovation continues to be a focus for us. State Street Global Advisors developed several new strategies including Global Alpha Plus, an innovative investment strategy designed to achieve consistent excess returns. It also launched a number of liability-driven investment strategies aimed at better matching assets to liabilities for pension funds. SSgA’s growing active product array contributed to more than half of its net new revenue in 2005. With a renewed focus on exchange-traded funds, SSgA also launched nine new ETFs during the year, including the SPDR® Dividend, and saw strong growth in some of its innovative approaches such as the streetTRACKS® Gold Shares.
Our research and trading capabilities, including foreign exchange, equity execution, transition management and securities finance activities, also posted record results in 2005. Daily trading volume on FX Connect,® our multibank electronic trading system, surpassed $45 billion and State Street remained the unmatched leader in transition management, managing more than $380 billion in transitions during the year. Continued demand for our quantitative investment research led us to expand our successful State Street Investor Confidence Index®, which now includes regional views for Europe, North America and the Asia-Pacific region.
As we advance our effort to serve customers in all the markets where they do business, we strengthened our presence in 2005 in Switzerland, the Netherlands and Hong Kong, and opened a representative office in Beijing, China. These markets will play an important role in our goal to increase revenue outside the United States.
Governance
State Street has made several recent changes to its corporate governance policies. First, we created a new chief compliance officer position charged with centralizing and overseeing State Street’s compliance program. Our board of directors – 13 out of 14 of whom qualify as independent under the New York Stock Exchange listing standards – are now elected annually, eliminating three-year terms of the past. Shareholders also now annually ratify the appointment of our auditors, Ernst & Young LLP. In 2005, the board adopted a majority voting standard requiring a director or nominee who receives a “withhold” vote from the majority of outstanding shares in an uncontested election of directors to submit his or her resignation, to be considered by the Nominating and Corporate Governance Committee.
Talent
Great companies are built around extraordinary individual execution. We must continue to invest in State Street’s future by developing and leveraging our deep pool of talented professionals. Today, we are investing in our employees at a higher level than ever before. In 2005, we added more training, enhanced our salary and promotions process, and undertook several initiatives to move executives within State Street globally to provide a deeper bench of talent that supports our succession planning. One such example is the appointment in 2005 of Bill Hunt, an 11-year company veteran, to lead State Street Global Advisors.
State Street employees continue to give their time and money to improve the communities where we live and work. In a year of unprecedented natural disasters around the world, State Street colleagues offered their help and support to a variety of relief efforts, while continuing to support local charitable endeavors. More than a quarter of our workforce invested approximately 30,000 hours of volunteer time around the globe last year. Giving back is an inherent part of the State Street culture and a source of great corporate pride.
In 2005, I believe State Street became a stronger, more efficient and more focused company. As we move into 2006, I’m encouraged that our business pipeline remains strong, and that we’re executing well against our strategic objectives. For 2006, we have once again set financial goals of achieving revenue growth between 8 and 12 percent, earnings per share growth between 10 and 15 percent and return on shareholders’ equity between 14 and 17 percent. We are currently targeting the middle of those ranges.
In my 18 months as State Street’s chairman and CEO, conversations with our customers have assured me of one thing: When customers come to State Street, they get a value they cannot find anywhere else. We delivered that value in 2005, and I will keep working to build on that value for all of our stakeholders in the future.
Sincerely,

Ronald E. Logue
Chairman and Chief Executive Officer
STATE STREET CORPORATION

| 2005 |
2004 |
2003 |
||||||||||
|---|---|---|---|---|---|---|---|---|---|---|---|---|
| (Dollars
in millions, except per share data or where otherwise indicated) |
||||||||||||
| Years
ended December 31, |
||||||||||||
| Fee
Revenue: |
||||||||||||
| Servicing
fees |
$ | 2,474 | $ | 2,263 | $ | 1,950 | ||||||
| Management
fees |
751 | 623 | 533 | |||||||||
| Trading
services |
694 | 595 | 529 | |||||||||
| Securities
finance |
330 | 259 | 245 | |||||||||
| Processing
fees and other |
302 | 308 | 299 | |||||||||
| Total
fee revenue |
4,551 | 4,048 | 3,556 | |||||||||
| Net
Interest Revenue: |
||||||||||||
| Interest
revenue |
2,930 | 1,787 | 1,539 | |||||||||
| Interest
expense |
2,023 | 928 | 729 | |||||||||
| Net
interest revenue |
907 | 859 | 810 | |||||||||
| Provision
for loan losses |
– | (18 | ) | – | ||||||||
| Net
interest revenue after provision for loan losses |
907 | 877 | 810 | |||||||||
| (Losses)
gains on sales of available-for-sale investment securities, net |
(1 | ) | 26 | 23 | ||||||||
| Gain
on sale of Private Asset Management business, net of exit and other associated
costs |
16 | – | 285 | |||||||||
| Gain
on sale of Corporate Trust business |
– | – | 60 | |||||||||
| Total
revenue |
5,473 | 4,951 | 4,734 | |||||||||
| Operating
Expenses: |
||||||||||||
| Salaries
and employee benefits |
2,231 | 1,957 | 1,731 | |||||||||
| Information
systems and communications |
486 | 527 | 551 | |||||||||
| Transaction
processing services |
449 | 398 | 314 | |||||||||
| Occupancy |
391 | 363 | 300 | |||||||||
| Merger,
integration and divestiture costs |
– | 62 | 110 | |||||||||
| Restructuring
costs |
– | 21 | 296 | |||||||||
| Other |
484 | 431 | 320 | |||||||||
| Total
operating expenses |
4,041 | 3,759 | 3,622 | |||||||||
| Income
from continuing operations before income tax expense |
1,432 | 1,192 | 1,112 | |||||||||
| Income
tax expense from continuing operations |
487 | 394 | 390 | |||||||||
| Income
from continuing operations |
945 | 798 | 722 | |||||||||
| Loss
from discontinued operations |
(165 | ) | – | – | ||||||||
| Income
tax benefit from discontinued operations |
(58 | ) | – | – | ||||||||
| Net
loss from discontinued operations |
(107 | ) | – | – | ||||||||
| Net
income |
$ | 838 | $ | 798 | $ | 722 | ||||||
| Earnings
Per Share From Continuing Operations: |
||||||||||||
| Basic |
$ | 2.86 | $ | 2.38 | $ | 2.18 | ||||||
| Diluted |
2.82 | 2.35 | 2.15 | |||||||||
| Loss
Per Share From Discontinued Operations: |
||||||||||||
| Basic |
$ | (.33 | ) | $ | – | $ | – | |||||
| Diluted |
(.32 | ) | – | – | ||||||||
| Earnings
Per Share: |
||||||||||||
| Basic |
$ | 2.53 | $ | 2.38 | $ | 2.18 | ||||||
| Diluted |
2.50 | 2.35 | 2.15 | |||||||||
| Average
Shares Outstanding (in thousands): |
||||||||||||
| Basic |
330,361 | 334,606 | 331,692 | |||||||||
| Diluted |
334,636 | 339,605 | 335,326 | |||||||||
| 2005 |
2004 |
|||||||
|---|---|---|---|---|---|---|---|---|
| (Dollars
in millions) |
||||||||
| As
of December 31, |
||||||||
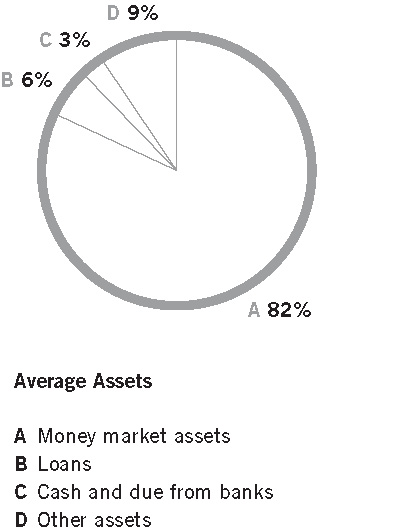
| Assets |
||||||||
| Cash
and due from banks |
$ | 2,684 | $ | 2,035 | ||||
| Interest-bearing deposits with banks |
11,275 | 20,634 | ||||||
| Securities
purchased under resale agreements |
8,679 | 12,878 | ||||||
| Federal
funds sold |
– | 5,450 | ||||||
| Trading
account assets |
764 | 745 | ||||||
| Investment
securities available for sale (including securities pledged of $26,573
and $27,273) |
54,979 | 36,171 | ||||||
| Investment
securities held to maturity (fair value of $4,815 and $1,389) |
4,891 | 1,400 | ||||||
| Loans
(less allowance of $18 and $18) |
6,464 | 4,611 | ||||||
| Premises
and equipment (net of accumulated depreciation of $2,149 and $1,923) |
1,453 | 1,444 | ||||||
| Accrued
income receivable |
1,364 | 1,204 | ||||||
| Goodwill |
1,337 | 1,497 | ||||||
| Other
intangible assets |
459 | 494 | ||||||
| Other
assets |
3,619 | 5,477 | ||||||
| Total
assets |
$ | 97,968 | $ | 94,040 | ||||
| Liabilities |
||||||||
| Deposits: |
||||||||
| Noninterest-bearing |
$ | 9,402 | $ | 13,671 | ||||
| Interest-bearing — U.S. |
2,379 | 2,843 | ||||||
| Interest-bearing — Non-U.S. |
47,865 | 38,615 | ||||||
| Total
deposits |
59,646 | 55,129 | ||||||
| Securities
sold under repurchase agreements |
20,895 | 21,881 | ||||||
| Federal
funds purchased |
1,204 | 435 | ||||||
| Other
short-term borrowings |
1,219 | 1,343 | ||||||
| Accrued
taxes and other expenses |
2,632 | 2,603 | ||||||
| Other
liabilities |
3,346 | 4,032 | ||||||
| Long-term
debt |
2,659 | 2,458 | ||||||
| Total
liabilities |
91,601 | 87,881 | ||||||
| Commitments
and contingencies (Note 9) |
||||||||
| Shareholders’ Equity |
||||||||
| Preferred
stock, no par: authorized 3,500,000 shares; issued none |
||||||||
| Common
stock, $1 par: authorized 500,000,000 shares; issued 337,126,000 and 337,126,000
shares |
337 | 337 | ||||||
| Surplus |
266 | 289 | ||||||
| Retained
earnings |
6,189 | 5,590 | ||||||
| Accumulated
other comprehensive (loss) income |
(231 | ) | 92 | |||||
| Treasury
stock, at cost (3,501,000 and 3,481,000 shares) |
(194 | ) | (149 | ) | ||||
| Total
shareholders’ equity |
6,367 | 6,159 | ||||||
| Total
liabilities and shareholders’ equity |
$ | 97,968 | $ | 94,040 | ||||
| COMMON STOCK | TREASURY STOCK | |||||||||||||||||||||||||||||||
|---|---|---|---|---|---|---|---|---|---|---|---|---|---|---|---|---|---|---|---|---|---|---|---|---|---|---|---|---|---|---|---|---|
| Shares |
Amount |
Surplus |
Retained Earnings |
Accumulated Other Comprehensive (Loss) Income |
Shares |
Amount |
Total |
|||||||||||||||||||||||||
| (Dollars
in millions, except per share data, shares in thousands) |
||||||||||||||||||||||||||||||||
| Balance
at December 31, 2002 |
329,992 | $ | 330 | $ | 104 | $ | 4,472 | $ | 106 | 5,065 | $ | (225 | ) | $ | 4,787 | |||||||||||||||||
| Comprehensive
Income: |
||||||||||||||||||||||||||||||||
| Net
income |
722 | 722 | ||||||||||||||||||||||||||||||
| Change
in net unrealized gains/losses on available-for-sale securities, net of
related taxes of $(20) |
(26 | ) | (26 | ) | ||||||||||||||||||||||||||||
| Foreign
currency translation, net of related taxes of $68 |
109 | 109 | ||||||||||||||||||||||||||||||
| Change
in unrealized gains/losses on cash flow hedges, net of related taxes of
$2 |
3 | 3 | ||||||||||||||||||||||||||||||
| Total
comprehensive income |
722 | 86 | 808 | |||||||||||||||||||||||||||||
| Cash
dividends declared — $.56 per share |
(187 | ) | (187 | ) | ||||||||||||||||||||||||||||
| Present
value of the estimated fees payable with respect to SPACES, pursuant to January 14, 2003 Registration Statement |
(57 | ) | (57 | ) | ||||||||||||||||||||||||||||
| Common
stock acquired |
80 | (3 | ) | (3 | ) | |||||||||||||||||||||||||||
| Common
Stock Issued Pursuant To: |
||||||||||||||||||||||||||||||||
| Public
stock offering |
7,153 | 7 | 260 | 267 | ||||||||||||||||||||||||||||
| Stock
awards and options exercised, including tax benefit of $13 |
(13 | ) | 4 | (2,025 | ) | 89 | 93 | |||||||||||||||||||||||||
| Debt
conversion |
(1 | ) | (21 | ) | 1 | – | ||||||||||||||||||||||||||
| Modified
stock awards and options for restructuring |
19 | (385 | ) | 17 | 36 | |||||||||||||||||||||||||||
| Other |
(56 | ) | 3 | 3 | ||||||||||||||||||||||||||||
| Balance
at December 31, 2003 |
337,132 | 337 | 329 | 5,007 | 192 | 2,658 | (118 | ) | 5,747 | |||||||||||||||||||||||
| Comprehensive
Income: |
||||||||||||||||||||||||||||||||
| Net
income |
798 | 798 | ||||||||||||||||||||||||||||||
| Change
in net unrealized gains/losses on available-for-sale securities, net of
related taxes of $(91) |
(130 | ) | (130 | ) | ||||||||||||||||||||||||||||
| Change
in minimum pension liability, net of related taxes of $(19) |
(26 | ) | (26 | ) | ||||||||||||||||||||||||||||
| Foreign
currency translation, net of related taxes of $17 |
85 | 85 | ||||||||||||||||||||||||||||||
| Change
in unrealized gains/losses on cash flow hedges, net of related taxes of
$(1) |
(3 | ) | (3 | ) | ||||||||||||||||||||||||||||
| Change
in unrealized gains/losses on hedges of net investments in foreign subsidiaries,
net of related taxes of $(14) |
(26 | ) | (26 | ) | ||||||||||||||||||||||||||||
| Total
comprehensive income |
798 | (100 | ) | 698 | ||||||||||||||||||||||||||||
| Cash
dividends declared — $.64 per share |
(215 | ) | (215 | ) | ||||||||||||||||||||||||||||
| Common
stock acquired |
4,098 | (178 | ) | (178 | ) | |||||||||||||||||||||||||||
| Impact
of fixing the variable-share settlement rate of SPACES |
(26 | ) | (26 | ) | ||||||||||||||||||||||||||||
| Common
Stock Issued Pursuant to: |
||||||||||||||||||||||||||||||||
| Stock
awards and options exercised, including tax benefit of $20 |
(6 | ) | (10 | ) | (3,128 | ) | 141 | 131 | ||||||||||||||||||||||||
| Debt
conversion |
(4 | ) | (104 | ) | 4 | – | ||||||||||||||||||||||||||
| Other |
(43 | ) | 2 | 2 | ||||||||||||||||||||||||||||
| Balance
at December 31, 2004 |
337,126 | 337 | 289 | 5,590 | 92 | 3,481 | (149 | ) | 6,159 | |||||||||||||||||||||||
| Comprehensive
Income: |
||||||||||||||||||||||||||||||||
| Net
income |
838 | 838 | ||||||||||||||||||||||||||||||
| Change
in net unrealized gains/losses on available-for-sale securities, net of
related taxes of $(150) |
(229 | ) | (229 | ) | ||||||||||||||||||||||||||||
| Foreign
currency translation, net of related taxes of $(54) |
(140 | ) | (140 | ) | ||||||||||||||||||||||||||||
| Change
in unrealized gains/losses on hedges of net investments in foreign subsidiaries,
net of related taxes of $20 |
37 | 37 | ||||||||||||||||||||||||||||||
| Change
in unrealized gains/losses on cash flow hedges, net of related taxes of
$6 |
9 | 9 | ||||||||||||||||||||||||||||||
| Total
comprehensive income |
838 | (323 | ) | 515 | ||||||||||||||||||||||||||||
| Cash
dividends declared — $.72 per share |
(239 | ) | (239 | ) | ||||||||||||||||||||||||||||
| Common
stock acquired |
13,130 | (664 | ) | (664 | ) | |||||||||||||||||||||||||||
| Common
Stock Issued Pursuant to: |
||||||||||||||||||||||||||||||||
| SPACES |
(73 | ) | (8,712 | ) | 418 | 345 | ||||||||||||||||||||||||||
| Stock
awards and options exercised, including tax benefit of $20 |
50 | (4,319 | ) | 197 | 247 | |||||||||||||||||||||||||||
| Other |
(79 | ) | 4 | 4 | ||||||||||||||||||||||||||||
| Balance
at December 31, 2005 |
337,126 | $ | 337 | $ | 266 | $ | 6,189 | $ | (231 | ) | 3,501 | $ | (194 | ) | $ | 6,367 | ||||||||||||||||
2005 |
2004 |
2003 |
||||||||||
|---|---|---|---|---|---|---|---|---|---|---|---|---|
| (Dollars
in millions) |
||||||||||||
| Years
ended December 31, |
||||||||||||
| Operating
Activities: |
||||||||||||
| Net
income |
$ | 838 | $ | 798 | $ | 722 | ||||||
| Adjustments
to reconcile net income to net cash provided by operating activities: |
||||||||||||
| Non-cash
adjustments for depreciation, amortization, accretion, provision for loan
losses and deferred income tax expense |
499 | 639 | 613 | |||||||||
| Write-down
of assets related to discontinued operations |
150 | – | – | |||||||||
| Gains
on sales of divested businesses, net of exit and other associated costs |
(16 | ) | – | (345 | ) | |||||||
| Securities
losses (gains), net |
1 | (26 | ) | (23 | ) | |||||||
| Change
in trading account assets, net |
(19 | ) | (340 | ) | 579 | |||||||
| Other,
net |
1,030 | (655 | ) | (57 | ) | |||||||
| Net
Cash Provided by Operating Activities |
2,483 | 416 | 1,489 | |||||||||
| Investing
Activities: |
||||||||||||
| Net
decrease in interest-bearing deposits with banks |
9,359 | 1,104 | 6,405 | |||||||||
| Net
decrease (increase) in federal funds sold and securities purchased under
resale agreements |
9,649 | (8,777 | ) | 7,664 | ||||||||
| Proceeds
from sales of available-for-sale securities |
3,299 | 8,035 | 13,676 | |||||||||
| Proceeds
from maturities of available-for-sale securities |
22,129 | 15,387 | 24,033 | |||||||||
| Purchases
of available-for-sale securities |
(44,758 | ) | (23,408 | ) | (46,799 | ) | ||||||
| Proceeds
from maturities of held-to-maturity securities |
1,132 | 1,107 | 1,362 | |||||||||
| Purchases
of held-to-maturity securities |
(4,623 | ) | (892 | ) | (1,440 | ) | ||||||
| Net
(increase) decrease in loans |
(1,801 | ) | 451 | (760 | ) | |||||||
| Proceeds
from sales of divested businesses, net |
16 | – | 347 | |||||||||
| Business
acquisitions, net of cash acquired |
(43 | ) | (100 | ) | (1,250 | ) | ||||||
| Purchases
of equity investments and other long-term assets |
(55 | ) | (86 | ) | (32 | ) | ||||||
| Purchases
of premises and equipment |
(314 | ) | (336 | ) | (324 | ) | ||||||
| Other |
58 | 60 | 27 | |||||||||
| Net
Cash (Used) Provided by Investing Activities |
(5,952 | ) | (7,455 | ) | 2,909 | |||||||
| Financing
Activities: |
||||||||||||
| Net
(decrease) increase in time deposits |
(5,341 | ) | 3,569 | 2,922 | ||||||||
| Net
increase (decrease) in all other deposits |
9,895 | 4,015 | (2,103 | ) | ||||||||
| Net
decrease in short-term borrowings |
(341 | ) | (1,603 | ) | (4,036 | ) | ||||||
| Proceeds
from issuance of long-term debt, net of issuance costs |
595 | – | 742 | |||||||||
| Payments
for long-term debt and obligations under capital leases |
(370 | ) | (9 | ) | (102 | ) | ||||||
| Proceeds
from SPACES, net of issuance costs |
345 | – | 257 | |||||||||
| Purchases
of common stock |
(664 | ) | (178 | ) | (3 | ) | ||||||
| Proceeds
from issuance of treasury stock for stock awards and options exercised |
231 | 113 | 119 | |||||||||
| Payments
for cash dividends |
(232 | ) | (209 | ) | (179 | ) | ||||||
| Net
Cash Provided (Used) by Financing Activities |
4,118 | 5,698 | (2,383 | ) | ||||||||
| Net
Increase (Decrease) |
649 | (1,341 | ) | 2,015 | ||||||||
| Cash
and Due from Banks at Beginning of Year |
2,035 | 3,376 | 1,361 | |||||||||
| Cash
and Due from Banks at End of Year |
$ | 2,684 | $ | 2,035 | $ | 3,376 | ||||||
| Supplemental
Disclosure: |
||||||||||||
| Interest
paid |
$ | 1,965 | $ | 911 | $ | 736 | ||||||
| Income
taxes paid |
331 | 211 | 175 | |||||||||
| Non-cash
investments in capital leases |
9 | 235 | 287 | |||||||||
resale agreements, allowing borrowers the right of collateral substitution and/or short-notice termination. We revalue these securities daily to determine if additional collateral is necessary from the borrower to protect us against credit exposure. We can use these securities as collateral for repurchase agreements. For securities sold under repurchase agreements collateralized by our U.S. government securities portfolio, the dollar value of the U.S. government securities remains in investment securities in our statement of condition. Where a master netting agreement exists or both parties are members of a common clearing organization, resale and repurchase agreements with the same counterparty or clearing house and maturity date are reported on a net basis.
| 2005 |
2004 |
2003 |
||||||||||||
|---|---|---|---|---|---|---|---|---|---|---|---|---|---|---|
| Dividend
yield |
1.85 | % | 1.35 | % | 1.46 | % | ||||||||
| Expected
volatility |
28.70 | 27.10 | 30.00 | |||||||||||
| Risk-free
interest rate |
4.19 | 3.02 | 3.10 | |||||||||||
| |
||||||||||||||
| Expected
option lives (in years) |
7.8 | 5.0 | 5.2 | |||||||||||
| 2005 |
2004 |
2003 |
||||||||||||
|---|---|---|---|---|---|---|---|---|---|---|---|---|---|---|
| (Dollars
in millions, except per share data) |
||||||||||||||
| Years
Ended December 31, |
||||||||||||||
|
Net
income, as reported |
$ | 838 | $ | 798 | $ | 722 | ||||||||
| Add:
Stock option compensation expense included in reported net income, net
of related taxes |
20 | 15 | 22 | (1) | ||||||||||
|
Deduct:
Total stock option compensation expense determined under fair value method
for all awards, net of related taxes |
(27 | ) | (42 | ) | (61 | ) | ||||||||
| Pro
forma net income |
$ | 831 | $ | 771 | $ | 683 | ||||||||
|
Earnings
per share: |
||||||||||||||
| Basic
— as reported |
$ | 2.53 | $ | 2.38 | $ | 2.18 | ||||||||
|
Basic
— pro forma |
2.51 | 2.30 | 2.06 | |||||||||||
| Diluted
— as reported |
$ | 2.50 | $ | 2.35 | $ | 2.15 | ||||||||
|
Diluted
— pro forma |
2.48 | 2.27 | 2.04 | |||||||||||
(1) |
We accelerated the recognition of stock option-related expense of $29 million, or $19 million after-tax, in the second quarter of 2003 in connection with restructuring activities. The remaining $3 million of after-tax expense related to the adoption of fair value accounting for stock options. See Note 19 for additional information related to restructuring costs. |
guidance in this FSP nullifies certain previous accounting requirements of Emerging Issues Task Force Issue No. 03-01, “The Meaning of Other-Than-Temporary Impairment and Its Application to Certain Investments,” and is effective for reporting periods beginning after December 15, 2005. We do not expect application of the FSP to have a significant impact on our consolidated financial position or results of operations.
2005 |
2004 |
|||||||||||||||||||||||||||||||
|---|---|---|---|---|---|---|---|---|---|---|---|---|---|---|---|---|---|---|---|---|---|---|---|---|---|---|---|---|---|---|---|---|
| Gross Unrealized |
Gross Unrealized |
|||||||||||||||||||||||||||||||
| Amortized Cost |
Gains |
Losses |
Fair Value |
Amortized Cost |
Gains |
Losses |
Fair Value |
|||||||||||||||||||||||||
| (Dollars
in millions) |
||||||||||||||||||||||||||||||||
| Available
for Sale: |
||||||||||||||||||||||||||||||||
U.S.
Treasury and federal agencies: |
||||||||||||||||||||||||||||||||
Direct
obligations |
$ | 10,340 | $ | 126 | $ | 10,214 | $ | 12,201 | $ | 82 | $ | 12,119 | ||||||||||||||||||||
Mortgage-backed securities |
11,387 | $ | 5 | 254 | 11,138 | 9,178 | $ | 23 | 54 | 9,147 | ||||||||||||||||||||||
Asset-backed
securities |
23,892 | 13 | 63 | 23,842 | 10,071 | 10 | 25 | 10,056 | ||||||||||||||||||||||||
Collateralized
mortgage obligations |
5,598 | 1 | 72 | 5,527 | 1,729 | 1 | 11 | 1,719 | ||||||||||||||||||||||||
State
and political subdivisions |
1,864 | 12 | 8 | 1,868 | 1,763 | 24 | 2 | 1,785 | ||||||||||||||||||||||||
Other
debt investments |
1,703 | 1 | 9 | 1,695 | 918 | 4 | – | 922 | ||||||||||||||||||||||||
Money-market
mutual funds |
232 | – | – | 232 | 97 | – | – | 97 | ||||||||||||||||||||||||
Other
equity securities |
438 | 27 | 2 | 463 | 310 | 17 | 1 | 326 | ||||||||||||||||||||||||
Total |
$ | 55,454 | $ | 59 | $ | 534 | $ | 54,979 | $ | 36,267 | $ | 79 | $ | 175 | $ | 36,171 | ||||||||||||||||
Held
to Maturity: |
||||||||||||||||||||||||||||||||
U.S.
Treasury and federal agencies: |
||||||||||||||||||||||||||||||||
Direct
obligations |
$ | 1,657 | – | $ | 21 | $ | 1,636 | $ | 1,294 | – | $ | 11 | $ | 1,283 | ||||||||||||||||||
Mortgage-backed securities |
925 | – | 14 | 911 | – | – | – | – | ||||||||||||||||||||||||
Collateralized
mortgage obligations |
2,086 | – | 40 | 2,046 | – | – | – | – | ||||||||||||||||||||||||
Other
investments |
223 | – | 1 | 222 | 106 | – | – | 106 | ||||||||||||||||||||||||
Total |
$ | 4,891 | – | $ | 76 | $ | 4,815 | $ | 1,400 | – | $ | 11 | $ | 1,389 | ||||||||||||||||||
| Less than 12 continuous months |
12
continuous months or longer |
Total |
||||||||||||||||||||||
|---|---|---|---|---|---|---|---|---|---|---|---|---|---|---|---|---|---|---|---|---|---|---|---|---|
| Fair
Value |
Gross Unrealized Losses |
Fair
Value |
Gross Unrealized Losses |
Fair
Value |
Gross Unrealized Losses |
|||||||||||||||||||
| (Dollars
in millions) |
||||||||||||||||||||||||
| U.S.
Treasury and federal agencies: |
||||||||||||||||||||||||
| Direct
obligations |
$ | 3,449 | $ | 21 | $ | 8,386 | $ | 126 | $ | 11,835 | $ | 147 | ||||||||||||
| Mortgage-backed securities |
40 | — | 12,009 | 268 | 12,049 | 268 | ||||||||||||||||||
| Asset-backed
securities |
1,852 | 5 | 21,731 | 58 | 23,583 | 63 | ||||||||||||||||||
| Collateralized mortgage obligations |
97 | 2 | 7,421 | 110 | 7,518 | 112 | ||||||||||||||||||
| State
and political subdivisions |
354 | 2 | 1,022 | 6 | 1,376 | 8 | ||||||||||||||||||
| Other
debt investments |
512 | — | 1,138 | 10 | 1,650 | 10 | ||||||||||||||||||
| Other
equity securities |
5 | 2 | 4 | — | 9 | 2 | ||||||||||||||||||
| Total |
$ | 6,309 | $ | 32 | $ | 51,711 | $ | 578 | $ | 58,020 | $ | 610 | ||||||||||||
| 2005 |
2004 |
2003 |
||||||||||||
|---|---|---|---|---|---|---|---|---|---|---|---|---|---|---|
| (Dollars
in millions) |
||||||||||||||
| Gross
gains |
$ | 9 | $ | 49 | $ | 56 | ||||||||
| Gross
losses |
10 | 23 | 33 | |||||||||||
| Net
(losses) gains |
$ | (1 | ) | $ | 26 | $ | 23 | |||||||
| Under 1 |
1
to 5 |
6
to 10 |
Over
10 |
|||||||||||||
|---|---|---|---|---|---|---|---|---|---|---|---|---|---|---|---|---|
| Year |
Years |
Years |
Years |
|||||||||||||
| (Dollars
in millions) |
||||||||||||||||
|
Available
for Sale: |
||||||||||||||||
| U.S.
Treasury and federal agencies: |
||||||||||||||||
| Direct
obligations |
$ | 2,614 | $ | 7,103 | $ | 497 | ||||||||||
| Mortgage-backed securities |
40 | 1,107 | 5,154 | $ | 4,837 | |||||||||||
| Asset-backed
securities |
1,818 | 9,373 | 9,309 | 3,342 | ||||||||||||
| Collateralized
mortgage obligations |
97 | 1,948 | 2,404 | 1,078 | ||||||||||||
| State
and political subdivisions |
321 | 783 | 627 | 137 | ||||||||||||
| Other
investments |
685 | 613 | 389 | 8 | ||||||||||||
| Total |
$ | 5,575 | $ | 20,927 | $ | 18,380 | $ | 9,402 | ||||||||
| Held
to Maturity: |
||||||||||||||||
| U.S.
Treasury and federal agencies: |
||||||||||||||||
| Direct
obligations |
$ | 856 | $ | 801 | ||||||||||||
| Mortgage-backed securities |
— | — | $ | 226 | $ | 699 | ||||||||||
| Collateralized
mortgage obligations |
— | 354 | 1,007 | 725 | ||||||||||||
| Other
investments |
73 | 65 | 81 | 4 | ||||||||||||
| Total |
$ | 929 | $ | 1,220 | $ | 1,314 | $ | 1,428 | ||||||||
| 2005 |
2004 |
|||||||||
|---|---|---|---|---|---|---|---|---|---|---|
| (Dollars
in millions) |
||||||||||
| Commercial
and Financial: |
||||||||||
| U.S. |
$ | 2,298 | $ | 1,826 | ||||||
| Non-U.S. |
1,854 | 526 | ||||||||
| Lease
Financing: |
||||||||||
| U.S. |
404 | 373 | ||||||||
| Non-U.S. |
1,926 | 1,904 | ||||||||
| Total
loans |
6,482 | 4,629 | ||||||||
| Less
allowance for loan losses |
(18 | ) | (18 | ) | ||||||
| Net
loans |
$ | 6,464 | $ | 4,611 | ||||||
| 2005 |
2004 |
2003 |
||||||||||||
|---|---|---|---|---|---|---|---|---|---|---|---|---|---|---|
| (Dollars
in millions) |
||||||||||||||
| Balance
at beginning of year |
$ | 18 | $ | 61 | $ | 61 | ||||||||
| Provision
for loan losses |
– | (18 | ) | – | ||||||||||
| Reclassification |
– | (25 | ) | – | ||||||||||
| Balance
at end of year |
$ | 18 | $ | 18 | $ | 61 | ||||||||
| Investment Servicing |
Investment Management |
Total |
||||||||||||
|---|---|---|---|---|---|---|---|---|---|---|---|---|---|---|
| (Dollars
in millions) |
||||||||||||||
| Balance
at December 31, 2003 |
$ | 1,157 | $ | 212 | $ | 1,369 | ||||||||
| Goodwill
acquired: |
||||||||||||||
| 2004
acquisitions |
10 | 2 | 12 | |||||||||||
| Purchase
price adjustments from prior period acquisitions |
72 | – | 72 | |||||||||||
| Translation
adjustments |
45 | (1 | ) | 44 | ||||||||||
| Balance
at December 31, 2004 |
1,284 | 213 | 1,497 | |||||||||||
| Purchase
price adjustments from prior period acquisitions |
42 | 1 | 43 | |||||||||||
| Write-off
of Bel Air goodwill |
– | (144 | ) | (144 | ) | |||||||||
| Reclassification of Bel Air goodwill |
62 | (62 | ) | – | ||||||||||
| Translation
adjustments |
(58 | ) | (1 | ) | (59 | ) | ||||||||
| Balance
at December 31, 2005 |
$ | 1,330 | $ | 7 | $ | 1,337 | ||||||||
| 2005 |
2004 |
|||||||||||||||||||||||
|---|---|---|---|---|---|---|---|---|---|---|---|---|---|---|---|---|---|---|---|---|---|---|---|---|
| Gross Carrying Amount |
Accumulated Amortization |
Net Carrying Amount |
Gross Carrying Amount |
Accumulated Amortization |
Net Carrying Amount |
|||||||||||||||||||
| (Dollars
in millions) |
||||||||||||||||||||||||
| Customer
lists |
$ | 529 | $ | (118 | ) | $ | 411 | $ | 553 | $ | (86 | ) | $ | 467 | ||||||||||
| Pension
unrecognized prior service costs |
20 | – | 20 | 17 | – | 17 | ||||||||||||||||||
| Other |
33 | (5 | ) | 28 | 11 | (1 | ) | 10 | ||||||||||||||||
| Total |
$ | 582 | $ | (123 | ) | $ | 459 | $ | 581 | $ | (87 | ) | $ | 494 | ||||||||||
| (Dollars in millions) |
||||||
|---|---|---|---|---|---|---|
| 2006 |
$ | 17,375 | ||||
| 2007 |
301 | |||||
| 2008 |
– | |||||
| 2009 |
158 | |||||
| 2010 |
– | |||||
| After
2010 |
6 | |||||
| Total |
$ | 17,840 | ||||
| (Dollars in millions) |
|||||
|---|---|---|---|---|---|
| 3
months or less |
$ | 7,886 | |||
| 4
months to a year |
1,191 | ||||
| Over
one year |
465 | ||||
| Total |
$ | 9,542 | |||
| Federal
Funds Purchased |
Securities Sold Under Repurchase Agreements |
|||||||||||||||||||||||
|---|---|---|---|---|---|---|---|---|---|---|---|---|---|---|---|---|---|---|---|---|---|---|---|---|
| 2005 |
2004 |
2003 |
2005 |
2004 |
2003 |
|||||||||||||||||||
| (Dollars
in millions) |
||||||||||||||||||||||||
| Balance
at December 31, |
$ | 1,204 | $ | 435 | $ | 1,019 | $ | 20,895 | $ | 21,881 | $ | 22,806 | ||||||||||||
| Maximum
outstanding at any month end |
3,982 | 5,500 | 4,690 | 24,690 | 26,773 | 28,579 | ||||||||||||||||||
| Average
outstanding during the year |
2,306 | 2,891 | 2,901 | 22,432 | 22,989 | 22,724 | ||||||||||||||||||
| Weighted
average interest rate at end of year |
4.08 | % | 1.75 | % | 1.00 | % | 3.79 | % | 1.64 | % | .73 | % | ||||||||||||
| Weighted
average interest rate during the year |
3.23 | 1.40 | 1.13 | 2.73 | 1.02 | .90 | ||||||||||||||||||
| (Dollars in millions) |
|||||
|---|---|---|---|---|---|
| Collateralized
with securities purchased under resale agreements |
$ | 7,850 | |||
| Collateralized
with available-for-sale investment securities |
13,045 | ||||
| Total |
$ | 20,895 | |||
| U.S. Government Securities Sold |
Repurchase
Agreements |
|||||||||||||||||
|---|---|---|---|---|---|---|---|---|---|---|---|---|---|---|---|---|---|---|
| Amortized Cost |
Fair
Value |
Amortized Cost |
Rate |
|||||||||||||||
| (Dollars
in millions) |
||||||||||||||||||
| Overnight
maturity |
$ | 13,428 | $ | 13,188 | $ | 13,045 | 3.79 | % | ||||||||||
| 2005 |
2004 |
|||||||||
|---|---|---|---|---|---|---|---|---|---|---|
| (Dollars
in millions) |
||||||||||
| Statutory
Business Trusts: |
||||||||||
| 8.035%
Subordinated notes due to State Street Capital Trust B in 2027(1) |
$ | 322 | $ | 335 | ||||||
|
7.94%
Subordinated notes due to State Street Capital Trust A in 2026(1) |
210 | 218 | ||||||||
| Floating
Rate Subordinated notes due to State Street Capital Trust I in 2028(2) |
154 | 154 | ||||||||
|
Floating
Rate Subordinated notes due to State Street Capital Trust II in 2008 |
– | 356 | ||||||||
| Parent
Company and Non-Bank Subsidiary Issuances: |
||||||||||
|
Long-term
capital lease |
515 | 518 | ||||||||
| 7.65%
Subordinated notes due 2010(1) |
295 | 306 | ||||||||
|
7.35%
Subordinated notes due 2026 |
150 | 150 | ||||||||
| 9.50%
Mortgage note due 2009 |
9 | 11 | ||||||||
|
State
Street Bank Issuances: |
||||||||||
| 5.25%
Subordinated notes due 2018(1) |
405 | 410 | ||||||||
|
5.30%
Subordinated notes due 2016 |
399 | – | ||||||||
| Floating
Rate Subordinated notes Due 2015 (2) |
200 | – | ||||||||
|
Total
long-term debt |
$ | 2,659 | $ | 2,458 | ||||||
(1) |
We have entered into various interest-rate swap contracts to modify our interest expense on certain subordinated notes from a fixed rate to a floating rate. These swaps are recorded as fair value hedges, and at December 31, 2005 and 2004, we recorded increases in the carrying value of long-term debt outstanding of $18 million and $55 million, respectively. |
(2) |
We have entered into interest-rate swaps that are recorded as cash flow hedges to modify our floating-rate interest expense on the subordinated notes due 2028 and 2015 to a fixed rate. |
| 2005 |
2004 |
|||||||||
|---|---|---|---|---|---|---|---|---|---|---|
| (Dollars
in millions) |
||||||||||
| Indemnified
securities financing |
$ | 372,863 | $ | 349,543 | ||||||
| Liquidity
asset purchase agreements |
24,412 | 20,410 | ||||||||
| Unfunded
commitments to extend credit |
14,403 | 12,731 | ||||||||
| Standby
letters of credit |
5,027 | 4,784 | ||||||||
| 2005 |
2004 |
2003 |
||||||||||||
|---|---|---|---|---|---|---|---|---|---|---|---|---|---|---|
| (Dollars
in millions) |
||||||||||||||
| Foreign
currency translation |
$ | 73 | $ | 213 | $ | 128 | ||||||||
| Unrealized
gain (loss) on hedge of net foreign investment in subsidiaries |
11 | (26 | ) | – | ||||||||||
| Unrealized
(loss) gain on available-for-sale securities |
(285 | ) | (56 | ) | 74 | |||||||||
| Minimum
pension liability |
(26 | ) | (26 | ) | – | |||||||||
| Unrealized
loss on cash flow hedges |
(4 | ) | (13 | ) | (10 | ) | ||||||||
| Total |
$ | (231 | ) | $ | 92 | $ | 192 | |||||||
| STOCK OPTIONS |
||||||||||||||
|---|---|---|---|---|---|---|---|---|---|---|---|---|---|---|
| Option
Price Per Share |
Weighted Average Option Price |
Shares |
||||||||||||
| (Shares
in thousands) |
||||||||||||||
| December
31, 2002 |
$ | 1.75–60.74 | $40.35 | 26,314 | ||||||||||
| Granted |
37.57–49.84 | 46.20 | 5,672 | |||||||||||
| Exercised |
1.75–44.02 | 26.76 | (1,765 | ) | ||||||||||
| Canceled |
8.13–60.74 | 48.39 | (655 | ) | ||||||||||
| December
31, 2003 |
1.75–60.74 | 42.13 | 29,566 | |||||||||||
| Granted |
45.18–52.96 | 52.44 | 2,369 | |||||||||||
| Exercised |
1.75–57.29 | 24.29 | (1,897 | ) | ||||||||||
| Canceled |
8.13–60.74 | 48.64 | (1,555 | ) | ||||||||||
| December
31, 2004 |
5.61–60.74 | 43.82 | 28,483 | |||||||||||
| Granted |
44.53–49.12 | 44.73 | 1,292 | |||||||||||
| Exercised |
5.61–53.05 | 35.49 | (3,690 | ) | ||||||||||
| Canceled |
8.13–60.74 | 49.97 | (2,129 | ) | ||||||||||
| December
31, 2005 |
5.61–60.74 | 44.60 | 23,956 | |||||||||||
| RANGE OF EXERCISE PRICES |
||||||||||||||||||||||
|---|---|---|---|---|---|---|---|---|---|---|---|---|---|---|---|---|---|---|---|---|---|---|
| Shares
Outstanding |
Shares
Exercisable |
|||||||||||||||||||||
| Number
of Shares Outstanding |
Weighted Average Remaining Contractual Life (years) |
Weighted Average Exercise Price |
Number
of Shares Exercisable |
Weighted Average Exercise Price |
||||||||||||||||||
| (Shares
in thousands) |
||||||||||||||||||||||
| $5.61–28.16 |
821 | 1.3 | $ | 23.24 | 821 | $ | 23.24 | |||||||||||||||
| 32.23–39.95 |
7,233 | 5.5 | 38.01 | 6,948 | 37.95 | |||||||||||||||||
| 40.22–49.81 |
9,448 | 7.1 | 45.02 | 4,521 | 44.33 | |||||||||||||||||
| 51.10–60.74 |
6,454 | 6.0 | 54.07 | 4,612 | 54.59 | |||||||||||||||||
| 5.61–60.74 |
23,956 | 6.1 | 44.60 | 16,902 | 43.48 | |||||||||||||||||
| Regulatory Guidelines(1) |
State
Street |
State
Street Bank |
|||||||||||||||||||||||
|---|---|---|---|---|---|---|---|---|---|---|---|---|---|---|---|---|---|---|---|---|---|---|---|---|---|
| Minimum |
Well Capitalized |
2005 |
2004 |
2005 |
2004 |
||||||||||||||||||||
| (Dollars
in millions) |
|||||||||||||||||||||||||
| Risk-Based
Ratios: |
|||||||||||||||||||||||||
| Tier
1 capital |
4 | % | 6 | % | 11.7 | % | 13.3 | % | 10.3 | % | 11.6 | % | |||||||||||||
| Total
capital |
8 | 10 | 14.0 | 14.7 | 12.5 | 12.5 | |||||||||||||||||||
| Tier
1 leverage ratio |
4 | 5 | 5.6 | 5.5 | 5.4 | 5.3 | |||||||||||||||||||
| Shareholders’ equity |
$ | 6,367 | $ | 6,159 | $ | 6,139 | $ | 6,262 | |||||||||||||||||
| Capital
securities |
650 | 995 | – | – | |||||||||||||||||||||
| Unrealized
losses on available-for-sale securities |
285 | 56 | 292 | 63 | |||||||||||||||||||||
| Unrealized
losses (gains) on cash flow hedges |
4 | 13 | (10 | ) | (1 | ) | |||||||||||||||||||
| Qualifying
minority interest in consolidated subsidiaries |
2 | 3 | 2 | 3 | |||||||||||||||||||||
| Less: |
|||||||||||||||||||||||||
| Goodwill |
1,337 | 1,497 | 1,247 | 1,408 | |||||||||||||||||||||
| Other
intangible assets |
459 | 494 | 438 | 492 | |||||||||||||||||||||
| Other
deductions |
1 | 2 | – | – | |||||||||||||||||||||
| Tier
1 capital |
5,511 | 5,233 | 4,738 | 4,426 | |||||||||||||||||||||
| Qualifying
subordinated debt |
1,238 | 698 | 998 | 399 | |||||||||||||||||||||
| Allowance
for on- and off-balance sheet loan losses |
30 | 30 | 30 | 30 | |||||||||||||||||||||
| Unrealized
gains on available-for-sale equity securities |
12 | 7 | 6 | 2 | |||||||||||||||||||||
| Tier
2 capital |
1,280 | 735 | 1,034 | 431 | |||||||||||||||||||||
| Deduction
for investments in finance subsidiaries |
(174 | ) | (165 | ) | (52 | ) | (62 | ) | |||||||||||||||||
| Total
capital |
$ | 6,617 | $ | 5,803 | $ | 5,720 | $ | 4,795 | |||||||||||||||||
| Adjusted
risk-weighted assets and market-risk equivalents: |
|||||||||||||||||||||||||
| On-balance
sheet |
$ | 27,288 | $ | 22,714 | $ | 25,965 | $ | 21,560 | |||||||||||||||||
| Off-balance
sheet |
19,586 | 16,398 | 19,602 | 16,403 | |||||||||||||||||||||
| Market-risk
equivalents |
361 | 288 | 351 | 253 | |||||||||||||||||||||
| Total |
$ | 47,235 | $ | 39,400 | $ | 45,918 | $ | 38,216 | |||||||||||||||||
| Quarterly
adjusted average assets |
$ | 98,970 | $ | 94,834 | $ | 87,667 | $ | 83,843 | |||||||||||||||||
(1) |
State Street Bank must meet the regulatory designation of “well capitalized” in order to maintain our status as a financial holding company, including maintaining a minimum Tier 1 risk-based capital ratio (Tier 1 capital divided by total adjusted risk-weighted assets and market-risk equivalents) of 6%, a minimum total risk-based capital ratio (total capital divided by total adjusted risk-weighted assets and market-risk equivalents) of 10%, and a Tier 1 leverage ratio (Tier 1 capital divided by quarterly adjusted average assets) of 5%. In addition, Federal Reserve Regulation Y defines “well capitalized” for a bank holding company such as us for the purpose of determining eligibility for a streamlined review process for acquisition proposals. For such Regulation Y purposes, “well capitalized” requires us to maintain a minimum Tier 1 risk-based capital ratio of 6% and a minimum total risk-based capital ratio of 10%. |
| 2005 |
2004 |
|||||||||
|---|---|---|---|---|---|---|---|---|---|---|
| (Dollars
in millions) |
||||||||||
|
Trading: |
||||||||||
| Interest-rate
contracts: |
||||||||||
|
Swap
agreements |
$ | 4,508 | $ | 1,450 | ||||||
| Options
and caps purchased |
912 | 310 | ||||||||
|
Options
and caps written |
2,564 | 1,464 | ||||||||
| Futures |
534 | 1,767 | ||||||||
|
Foreign
exchange contracts: |
||||||||||
| Forward,
swap and spot |
414,376 | 364,357 | ||||||||
|
Options
purchased |
6,624 | 3,298 | ||||||||
| Options
written |
6,763 | 3,214 | ||||||||
|
Asset
and Liability Management: |
||||||||||
| Interest-rate
contracts: |
||||||||||
|
Swap
agreements |
5,369 | 4,300 | ||||||||
| Foreign
exchange contracts: |
||||||||||
|
Swap
agreements |
355 | 407 | ||||||||
| 2005 |
2004 |
|||||||||||||||||||||||
|---|---|---|---|---|---|---|---|---|---|---|---|---|---|---|---|---|---|---|---|---|---|---|---|---|
| Fair Value Hedges |
Cash Flow Hedges |
Total |
Fair Value Hedges |
Cash Flow Hedges |
Total |
|||||||||||||||||||
| (Dollars
in millions) |
||||||||||||||||||||||||
| Available-for-sale investment securities |
$ | 2,211 | $ | 2,211 | $ | 1,515 | $ | 1,515 | ||||||||||||||||
| Interest-bearing time deposits(1) |
118 | $ | 1,490 | 1,608 | 245 | $ | 1,190 | 1,435 | ||||||||||||||||
| Long-term
debt(2)(3) |
1,200 | 350 | 1,550 | 1,200 | 150 | 1,350 | ||||||||||||||||||
| Total |
$ | 3,529 | $ | 1,840 | $ | 5,369 | $ | 2,960 | $ | 1,340 | $ | 4,300 | ||||||||||||
(1) |
For the years ended December 31, 2005 and 2004, the overall weighted-average interest rate for interest-bearing time deposits was 3.23% and 1.38%, respectively, on a contractual basis, and 3.19% and 1.35%, respectively, including the effects of hedges. |
(2) |
For the years ended December 31, 2005 and 2004, the fair value hedges of long-term debt increased the carrying value of long-term debt presented in our consolidated statement of condition by $18 million and $55 million, respectively. |
(3) |
For the years ended December 31, 2005 and 2004, the overall weighted-average interest rate for long-term debt was 6.58% and 6.30%, respectively, on a contractual basis, and 5.63% and 4.36%, respectively, including the effects of hedges. |
| 2005 |
2004 |
2003 |
||||||||||||
|---|---|---|---|---|---|---|---|---|---|---|---|---|---|---|
| (Dollars
in millions) |
||||||||||||||
| Interest
Revenue: |
||||||||||||||
| Deposits
with banks |
$ | 529 | $ | 591 | $ | 474 | ||||||||
| Investment
securities: |
||||||||||||||
| U.S.
Treasury and federal agencies |
866 | 536 | 409 | |||||||||||
| State
and political subdivisions (exempt from federal tax) |
58 | 57 | 62 | |||||||||||
| Other
investments |
873 | 277 | 259 | |||||||||||
| Securities
purchased under resale agreements and federal funds sold |
412 | 196 | 168 | |||||||||||
| Commercial
and financial loans |
106 | 59 | 61 | |||||||||||
| Lease
financing |
65 | 57 | 87 | |||||||||||
| Trading
account assets |
21 | 14 | 19 | |||||||||||
| Total
interest revenue |
2,930 | 1,787 | 1,539 | |||||||||||
| Interest
Expense: |
||||||||||||||
| Deposits |
1,132 | 512 | 372 | |||||||||||
| Other
short-term borrowings |
753 | 315 | 279 | |||||||||||
| Long-term
debt |
138 | 101 | 78 | |||||||||||
| Total
interest expense |
2,023 | 928 | 729 | |||||||||||
| Net
interest revenue |
$ | 907 | $ | 859 | $ | 810 | ||||||||
| Primary U.S. and Non-U.S. Defined Benefit Plans |
Post-Retirement
Plan |
|||||||||||||||
|---|---|---|---|---|---|---|---|---|---|---|---|---|---|---|---|---|
| 2005 |
2004 |
2005 |
2004 |
|||||||||||||
| (Dollars
in millions) |
||||||||||||||||
| Benefit
Obligations: |
||||||||||||||||
| Beginning
of year |
$ | 650 | $ | 587 | $ | 72 | $ | 65 | ||||||||
| Service
cost |
50 | 41 | 4 | 3 | ||||||||||||
| Interest
cost |
35 | 32 | 4 | 4 | ||||||||||||
| Transfers
in |
27 | – | – | – | ||||||||||||
| Actuarial
losses |
62 | 21 | 4 | 4 | ||||||||||||
| Benefits
paid |
(45 | ) | (44 | ) | (5 | ) | (4 | ) | ||||||||
| Expenses
paid |
(2 | ) | – | – | – | |||||||||||
| Special
termination benefits |
1 | – | – | – | ||||||||||||
| Foreign
currency translation |
(19 | ) | 13 | – | – | |||||||||||
| End
of year |
$ | 759 | $ | 650 | $ | 79 | $ | 72 | ||||||||
| Plan
Assets at Fair Value: |
||||||||||||||||
| Beginning
of year |
$ | 592 | $ | 512 | ||||||||||||
| Actual
return on plan assets |
63 | 59 | ||||||||||||||
| Employer
contributions |
98 | 57 | ||||||||||||||
| Transfers
in |
13 | – | ||||||||||||||
| Benefits
paid |
(45 | ) | (44 | ) | ||||||||||||
| Expenses
paid |
(2 | ) | – | |||||||||||||
| Foreign
currency translation |
(13 | ) | 8 | |||||||||||||
| End
of year |
$ | 706 | $ | 592 | ||||||||||||
| Accrued
Benefit Expense: |
||||||||||||||||
| Underfunded
status of the plans — liability |
$ | 53 | $ | 58 | $ | 79 | $ | 72 | ||||||||
| Unrecognized
net asset (obligation) at transition |
– | 1 | (6 | ) | (7 | ) | ||||||||||
| Unrecognized
net losses |
(263 | ) | (241 | ) | (22 | ) | (18 | ) | ||||||||
| Unrecognized
prior service benefits (costs) |
23 | 25 | – | – | ||||||||||||
| Net
(prepaid) accrued benefit expense |
$ | (187 | ) | $ | (157 | ) | $ | 51 | $ | 47 | ||||||
| Primary U.S. and Non-U.S. Defined Benefit Plans |
Post-Retirement
Plan |
|||||||||||||||
|---|---|---|---|---|---|---|---|---|---|---|---|---|---|---|---|---|
| 2005 |
2004 |
2005 |
2004 |
|||||||||||||
| (Dollars
in millions) |
||||||||||||||||
| Amounts
Recognized in the Consolidated Statement of Condition: |
||||||||||||||||
| As
of December 31: |
||||||||||||||||
| Prepaid
benefit cost |
$ | (183 | ) | $ | (170 | ) | ||||||||||
| Accrued
benefit cost |
26 | 45 | $ | 51 | $ | 47 | ||||||||||
| Intangible
assets |
– | (1 | ) | – | – | |||||||||||
| Other |
(30 | ) | (31 | ) | – | – | ||||||||||
| Net
(prepaid) accrued benefit expense |
$ | (187 | ) | $ | (157 | ) | $ | 51 | $ | 47 | ||||||
| Decrease
in minimum liability |
$ | – | $ | (2 | ) | $ | – | $ | – | |||||||
| Actuarial
Assumptions (U.S. Plans): |
||||||||||||||||
| Used
to determine benefit obligations as of December 31: |
||||||||||||||||
| Discount
rate |
5.50 | % | 5.75 | % | 5.50 | % | 5.75 | % | ||||||||
| Rate
of increase for future compensation |
4.50 | 4.50 | – | – | ||||||||||||
| Used
to determine periodic benefit cost for the years ended December 31: |
||||||||||||||||
| Discount
rate |
5.75 | % | 6.00 | % | 5.75 | % | 6.00 | % | ||||||||
| Rate
of increase for future compensation |
4.50 | 4.50 | – | – | ||||||||||||
| Expected
long-term rate of return on plan assets |
8.00 | 8.00 | – | – | ||||||||||||
| Assumed
health care cost trend rates as of December 31: |
||||||||||||||||
| Cost
trend rate assumed for next year |
– | – | 11.00 | % | 12.00 | % | ||||||||||
| Rate
to which the cost trend rate is assumed to decline |
– | – | 5.00 | 5.00 | ||||||||||||
| Year
that the rate reaches the ultimate trend rate |
– | – | 2013 | 2013 | ||||||||||||
| Primary U.S. and Non-U.S. Defined Benefit Plans |
Non-Qualified SERPs |
Post-Retirement Plan |
||||||||||||
|---|---|---|---|---|---|---|---|---|---|---|---|---|---|---|
| (Dollars
in millions) |
||||||||||||||
| 2006 |
$ | 46 | $ | 7 | $ | 6 | ||||||||
| 2007 |
38 | 7 | 5 | |||||||||||
| 2008 |
27 | 5 | 5 | |||||||||||
| 2009 |
24 | 4 | 4 | |||||||||||
| 2010 |
22 | 5 | 4 | |||||||||||
| 2011–2015 |
131 | 31 | 15 | |||||||||||
| ASSET CATEGORY |
||||||||||||||
|---|---|---|---|---|---|---|---|---|---|---|---|---|---|---|
| Strategic
Target Allocation |
Percentage
of Plan Assets at December 31, |
|||||||||||||
| 2006 |
2005 |
2004 |
||||||||||||
| Equity
securities |
55 | % | 59 | % | 59 | % | ||||||||
| Fixed
income securities |
30 | 29 | 30 | |||||||||||
| Other |
15 | 12 | 11 | |||||||||||
| Total |
100 | % | 100 | % | 100 | % | ||||||||
| Non-Qualified SERPs |
||||||||||
|---|---|---|---|---|---|---|---|---|---|---|
| 2005 |
2004 |
|||||||||
| (Dollars
in millions) |
||||||||||
| Benefit
Obligations: |
||||||||||
| Beginning
of year |
$ | 99 | $ | 91 | ||||||
| Service
cost |
4 | 5 | ||||||||
| Interest
cost |
5 | 6 | ||||||||
| Actuarial
loss |
11 | 7 | ||||||||
| Benefits
paid |
(8 | ) | (10 | ) | ||||||
| Settlements |
(8 | ) | (9 | ) | ||||||
| Amendments |
4 | 9 | ||||||||
| End
of year |
$ | 107 | $ | 99 | ||||||
| Accrued
Benefit Expense: |
||||||||||
| Underfunded
status of the plans |
$ | 107 | $ | 99 | ||||||
| Unrecognized
net loss |
(39 | ) | (33 | ) | ||||||
| Unrecognized
prior service cost |
(17 | ) | (14 | ) | ||||||
| Net
accrued benefit expense |
$ | 51 | $ | 52 | ||||||
| Amounts
Recognized in the Consolidated Statement of Condition: |
||||||||||
| Accrued
benefit cost |
$ | 78 | $ | 71 | ||||||
| Intangible
assets |
(20 | ) | (16 | ) | ||||||
| Other |
(7 | ) | (3 | ) | ||||||
| Net
accrued benefit expense |
$ | 51 | $ | 52 | ||||||
| Decrease
in minimum liability |
$ | (5 | ) | $ | (2 | ) | ||||
| Accumulated
benefit obligation |
$ | 78 | $ | 71 | ||||||
| Actuarial
assumptions used to determine benefit obligations and periodic benefit
costs are consistent with those noted for the post-retirement plan, with
the following exception: |
||||||||||
| Rate
of increase for future compensation |
4.75 | % | 4.75 | % | ||||||
| Primary U.S. and Non-U.S. Defined Benefit Plans |
Post-Retirement
Plan |
|||||||||||||||||||||||
|---|---|---|---|---|---|---|---|---|---|---|---|---|---|---|---|---|---|---|---|---|---|---|---|---|
| 2005 |
2004 |
2003 |
2005 |
2004 |
2003 |
|||||||||||||||||||
| (Dollars
in millions) |
||||||||||||||||||||||||
| Components
of Net Periodic Benefit Cost: |
||||||||||||||||||||||||
| Service
cost |
$ | 50 | $ | 41 | $ | 39 | $ | 3 | $ | 3 | $ | 3 | ||||||||||||
| Interest
cost |
35 | 32 | 30 | 4 | 4 | 3 | ||||||||||||||||||
| Assumed
return on plan assets |
(45 | ) | (40 | ) | (35 | ) | – | – | – | |||||||||||||||
| Amortization
of transition obligation (asset) |
– | (1 | ) | (2 | ) | 1 | 1 | 1 | ||||||||||||||||
| Amortization
of prior service cost |
(2 | ) | (2 | ) | – | – | – | – | ||||||||||||||||
| Amortization
of net loss (gain) |
15 | 16 | 12 | 1 | 1 | 1 | ||||||||||||||||||
| Net
periodic benefit cost |
53 | 46 | 44 | 9 | 9 | 8 | ||||||||||||||||||
| Special
Events Accounting Expense: |
||||||||||||||||||||||||
| Curtailments |
– | – | 3 | – | – | 7 | ||||||||||||||||||
| Special
termination benefits |
1 | – | 51 | – | – | 6 | ||||||||||||||||||
| Special
events accounting expense |
1 | – | 54 | – | – | 13 | ||||||||||||||||||
| Total
expense |
$ | 54 | $ | 46 | $ | 98 | $ | 9 | $ | 9 | $ | 21 | ||||||||||||
| Non-Qualified SERPs |
||||||||||||||
|---|---|---|---|---|---|---|---|---|---|---|---|---|---|---|
| 2005 |
2004 |
2003 |
||||||||||||
| (Dollars
in millions) |
||||||||||||||
| Components
of Net Periodic Benefit Cost: |
||||||||||||||
| Service
cost |
$ | 4 | $ | 5 | $ | 4 | ||||||||
| Interest
cost |
5 | 6 | 5 | |||||||||||
| Amortization
of prior service cost |
2 | 1 | 2 | |||||||||||
| Amortization
of net loss |
2 | 2 | 2 | |||||||||||
| Net
periodic benefit cost |
13 | 14 | 13 | |||||||||||
| Special
Events Accounting Expense: |
||||||||||||||
| Settlements |
2 | 1 | 1 | |||||||||||
| Curtailments |
– | – | 2 | |||||||||||
| Special
termination benefits |
– | – | 23 | |||||||||||
| Special
events accounting expense |
2 | 1 | 26 | |||||||||||
| Total
expense |
$ | 15 | $ | 15 | $ | 39 | ||||||||
| Capital Leases |
Operating Leases |
Total |
||||||||||||
|---|---|---|---|---|---|---|---|---|---|---|---|---|---|---|
| (Dollars
in millions) |
||||||||||||||
| 2006 |
$ | 51 | $ | 180 | $ | 231 | ||||||||
| 2007 |
51 | 157 | 208 | |||||||||||
| 2008 |
52 | 135 | 187 | |||||||||||
| 2009 |
52 | 121 | 173 | |||||||||||
| 2010 |
52 | 106 | 158 | |||||||||||
| Thereafter |
667 | 468 | 1,135 | |||||||||||
| Total
minimum lease payments |
925 | $ | 1,167 | $ | 2,092 | |||||||||
| Less
amount representing interest payments |
(410 | ) | ||||||||||||
| Present
value of minimum lease payments |
$ | 515 | ||||||||||||
| Restructuring Costs |
||||||
|---|---|---|---|---|---|---|
| (Dollars
in millions) |
||||||
| Costs
by Category: |
||||||
| Severance |
$ | 158 | ||||
| Pension |
80 | |||||
| Stock-based
compensation |
36 | |||||
| Other |
22 | |||||
| Total |
$ | 296 | ||||
| Costs
by Line of Business: |
||||||
| Investment
Servicing |
$ | 262 | ||||
| Investment
Management |
34 | |||||
| Total |
$ | 296 | ||||
| 2005 |
2004 |
2003 |
||||||||||||
|---|---|---|---|---|---|---|---|---|---|---|---|---|---|---|
| (Dollars
in millions) |
||||||||||||||
| Professional
services |
$ | 184 | $ | 165 | $ | 94 | ||||||||
| Advertising
and sales promotion |
42 | 44 | 40 | |||||||||||
| Other |
258 | 222 | 186 | |||||||||||
| Total
operating expenses — other |
$ | 484 | $ | 431 | $ | 320 | ||||||||
| 2005 |
2004 |
2003 |
||||||||||||
|---|---|---|---|---|---|---|---|---|---|---|---|---|---|---|
| (Dollars
in millions) |
||||||||||||||
| Current: |
||||||||||||||
| Federal |
$ | 197 | $ | 31 | $ | 54 | ||||||||
| State |
49 | 27 | 48 | |||||||||||
| Non-U.S. |
138 | 157 | 59 | |||||||||||
| Total
current |
384 | 215 | 161 | |||||||||||
| Deferred: |
||||||||||||||
| Federal |
72 | 160 | 168 | |||||||||||
| State |
10 | 23 | 35 | |||||||||||
| Non-U.S. |
21 | (4 | ) | 26 | ||||||||||
| Total
deferred |
103 | 179 | 229 | |||||||||||
| Total
income tax expense from continuing operations |
$ | 487 | $ | 394 | $ | 390 | ||||||||
2005 |
2004 |
|||||||||
|---|---|---|---|---|---|---|---|---|---|---|
| (Dollars
in millions) |
||||||||||
| Deferred
Tax Liabilities: |
||||||||||
| Lease
financing transactions |
$ | 1,735 | $ | 1,653 | ||||||
| Foreign
currency translation |
34 | 89 | ||||||||
| Pension |
53 | 51 | ||||||||
| Other |
40 | 53 | ||||||||
| Operating
expenses |
20 | 1 | ||||||||
| Total
deferred tax liabilities |
1,882 | 1,847 | ||||||||
| Deferred
Tax Assets: |
||||||||||
| Unrealized
losses on available-for-sale securities, net |
190 | 40 | ||||||||
| Deferred
compensation |
70 | 61 | ||||||||
| Unrealized
loss related to discontinued operations |
58 | – | ||||||||
| Allowance
for loan losses |
11 | 11 | ||||||||
| Tax
carryforwards |
1 | 69 | ||||||||
| Other |
44 | 76 | ||||||||
| Total
deferred tax assets |
374 | 257 | ||||||||
| Valuation
allowance for deferred tax assets |
1 | 1 | ||||||||
| Net
deferred tax assets |
373 | 256 | ||||||||
| Net
deferred tax liabilities |
$ | 1,509 | $ | 1,591 | ||||||
| 2005 |
2004 |
2003 |
||||||||||||
|---|---|---|---|---|---|---|---|---|---|---|---|---|---|---|
| U.S.
federal income tax rate |
35.0 | % | 35.0 | % | 35.0 | % | ||||||||
| Changes
from Statutory Rate: |
||||||||||||||
| State
taxes, net of federal benefit |
3.3 | 3.7 | 3.8 | |||||||||||
| Tax-exempt
interest revenue, net of disallowed interest |
(1.5 | ) | (2.2 | ) | (2.6 | ) | ||||||||
| Tax
credits |
(1.3 | ) | (.6 | ) | (.9 | ) | ||||||||
| Foreign
tax differential |
(1.0 | ) | (1.1 | ) | (.8 | ) | ||||||||
| Leveraged
lease transactions — cumulative benefit |
– | (.9 | ) | – | ||||||||||
| Other,
net |
(.5 | ) | (.8 | ) | (.5 | ) | ||||||||
| Non-operating
item(1) |
– | – | 1.1 | |||||||||||
| Effective
tax rate |
34.0 | % | 33.1 | % | 35.1 | % | ||||||||
(1) |
The non-operating item reported in 2003 related to an increase in the effective tax rate for a state tax matter that was settled. |
| 2005 |
2004 |
2003 |
|||||||
|---|---|---|---|---|---|---|---|---|---|
| (Dollars
in millions, except per share amounts) |
|||||||||
| Net
Income |
$ | 838 | $ | 798 | $ | 722 | |||
| Average
Shares Outstanding (in thousands): |
|||||||||
| Basic
average shares |
330,361 | 334,606 | 331,692 | ||||||
| Effect
of dilutive securities: |
|||||||||
| Stock
options and stock awards |
2,762 | 3,358 | 2,938 | ||||||
| Equity-related financial instruments |
1,513 | 1,641 | 696 | ||||||
| Dilutive
average shares |
334,636 | 339,605 | 335,326 | ||||||
| Anti-dilutive
securities (in thousands)(1) |
8,791 | 10,289 | 13,216 | ||||||
| Earnings
per Share: |
|||||||||
| Basic |
$ | 2.53 | $ | 2.38 | $ | 2.18 | |||
| Diluted |
2.50 | 2.35 | 2.15 | ||||||
(1) |
Represents stock options outstanding but not included in the computation of diluted average shares because the exercise prices of the instruments were greater than the average fair value of our common stock during those periods. |
| Investment
Servicing |
Investment Management |
Business
Divestiture |
Other/One-Time |
Total |
|||||||||||||||||||||||||||||||||||||||||||||||||||||
|---|---|---|---|---|---|---|---|---|---|---|---|---|---|---|---|---|---|---|---|---|---|---|---|---|---|---|---|---|---|---|---|---|---|---|---|---|---|---|---|---|---|---|---|---|---|---|---|---|---|---|---|---|---|---|---|---|---|
| 2005 |
2004 |
2003 |
2005 |
2004 |
2003 |
2005 |
2004 |
2003 |
2005 |
2004 |
2003 |
2005 |
2004 |
2003 |
|||||||||||||||||||||||||||||||||||||||||||
| (Dollars
in millions, unless otherwise noted) |
|||||||||||||||||||||||||||||||||||||||||||||||||||||||||
| Years
ended December 31, |
|||||||||||||||||||||||||||||||||||||||||||||||||||||||||
| Fee
revenue: |
|||||||||||||||||||||||||||||||||||||||||||||||||||||||||
| Servicing
fees |
$ | 2,474 | $ | 2,263 | $ | 1,950 | $ | 2,474 | $ | 2,263 | $ | 1,950 | |||||||||||||||||||||||||||||||||||||||||||||
| Management
fees |
– | – | – | $ | 751 | $ | 623 | $ | 474 | $ | 59 | 751 | 623 | 533 | |||||||||||||||||||||||||||||||||||||||||||
| Trading
services |
694 | 595 | 529 | – | – | – | – | 694 | 595 | 529 | |||||||||||||||||||||||||||||||||||||||||||||||
| Securities
finance |
260 | 211 | 206 | 70 | 48 | 39 | – | 330 | 259 | 245 | |||||||||||||||||||||||||||||||||||||||||||||||
| Processing
fees and other |
221 | 239 | 277 | 81 | 69 | 34 | 1 | $ | (13 | ) | 302 | 308 | 299 | ||||||||||||||||||||||||||||||||||||||||||||
| Total
fee revenue |
3,649 | 3,308 | 2,962 | 902 | 740 | 547 | 60 | (13 | ) | 4,551 | 4,048 | 3,556 | |||||||||||||||||||||||||||||||||||||||||||||
| Net
interest revenue |
826 | 816 | 773 | 81 | 43 | 37 | – | – | 907 | 859 | 810 | ||||||||||||||||||||||||||||||||||||||||||||||
| Provision
for loan losses |
– | (18 | ) | – | – | – | – | – | – | – | (18 | ) | – | ||||||||||||||||||||||||||||||||||||||||||||
| Net
interest revenue after provision for loan losses |
826 | 834 | 773 | 81 | 43 | 37 | – | – | 907 | 877 | 810 | ||||||||||||||||||||||||||||||||||||||||||||||
| (Losses)
gains on sales of available-for-sale investment securities, net |
(1 | ) | 26 | 23 | – | – | – | – | – | (1 | ) | 26 | 23 | ||||||||||||||||||||||||||||||||||||||||||||
| Gains
on the sales of divested businesses, net |
– | – | – | – | – | – | – | $ | 16 | 345 | 16 | – | 345 | ||||||||||||||||||||||||||||||||||||||||||||
| Total
revenue |
4,474 | 4,168 | 3,758 | 983 | 783 | 584 | 60 | 16 | 332 | 5,473 | 4,951 | 4,734 | |||||||||||||||||||||||||||||||||||||||||||||
| Operating
expenses |
3,363 | 3,115 | 2,706 | 678 | 582 | 473 | 37 | – | $ | 62 | 406 | 4,041 | 3,759 | 3,622 | |||||||||||||||||||||||||||||||||||||||||||
| Income
from continuing operations before income taxes |
$ | 1,111 | $ | 1,053 | $ | 1,052 | $ | 305 | $ | 201 | $ | 111 | $ | 23 | $ | 16 | $ | (62 | ) | $ | (74 | ) | $ | 1,432 | $ | 1,192 | $ | 1,112 | |||||||||||||||||||||||||||||
| Pre-tax
margin |
25 | % | 25 | % | 28 | % | 31 | % | 26 | % | 19 | % | |||||||||||||||||||||||||||||||||||||||||||||
| Average
assets (in billions) |
$ | 96.9 | $ | 92.5 | $ | 80.6 | $ | 2.9 | $ | 2.6 | $ | 2.0 | $ | .1 | $ | 99.8 | $ | 95.1 | $ | 82.7 | |||||||||||||||||||||||||||||||||||||
| 2005 |
2004 |
2003 |
|||||||
|---|---|---|---|---|---|---|---|---|---|
| (Dollars
in millions) |
|||||||||
| Results
of Operations: |
|||||||||
| Total
fee revenue |
$ | 1,881 | $ | 1,549 | $ | 1,111 | |||
| Interest
revenue |
653 | 660 | 612 | ||||||
| Interest
expense |
404 | 393 | 288 | ||||||
| Net
interest revenue |
249 | 267 | 324 | ||||||
| Total
revenue |
2,130 | 1,816 | 1,435 | ||||||
| Operating
expenses |
1,589 | 1,309 | 1,045 | ||||||
| Income
before income taxes |
541 | 507 | 390 | ||||||
| Income
tax expense |
205 | 191 | 146 | ||||||
| Net
income |
$ | 336 | $ | 316 | $ | 244 | |||
| Assets: |
|||||||||
| Interest-bearing deposits with banks |
$ | 11,235 | $ | 20,451 | $ | 21,608 | |||
| Other
assets |
8,800 | 6,719 | 7,183 | ||||||
| Total
assets |
$ | 20,035 | $ | 27,170 | $ | 28,791 | |||
• |
For financial instruments that have quoted market prices, those quotes are used to determine fair value. |
• |
Financial instruments that have no defined maturity, have a remaining maturity of 180 days or less, or reprice frequently to a market rate are assumed to have a fair value that approximates reported value, after taking into consideration any applicable credit risk. |
• |
If no market quotes are available, financial instruments are valued by discounting the expected cash flow(s) using an estimated current market interest rate for the financial instrument. |
• |
For derivative financial instruments, fair value is estimated as the amount at which an asset or liability could be bought or sold in a current transaction between willing parties, other than in a forced liquidation or sale. |
| Reported Value |
Fair
Value |
|||||
|---|---|---|---|---|---|---|
| (Dollars
in millions) |
||||||
| 2005: |
||||||
| Financial
Assets: |
||||||
| Investment
securities: |
||||||
| Available
for sale |
$ | 54,979 | $ | 54,979 | ||
| Held
to maturity |
4,891 | 4,815 | ||||
| Net
loans (excluding leases) |
4,134 | 4,134 | ||||
| Unrealized
gains on derivative financial instruments — trading |
2,038 | 2,038 | ||||
| Unrealized
gains on derivative financial instruments — asset and liability management |
76 | 76 | ||||
| Financial
Liabilities: |
||||||
| Long-term
debt |
2,659 | 2,775 | ||||
| Unrealized
losses on derivative financial instruments — trading |
2,042 | 2,042 | ||||
| Unrealized
losses on derivative financial instruments — asset and liability
management |
76 | 76 | ||||
| 2004: |
||||||
| Financial
Assets: |
||||||
| Investment
securities: |
||||||
| Available
for sale |
$ | 36,171 | $ | 36,171 | ||
| Held
to maturity |
1,400 | 1,389 | ||||
| Net
loans (excluding leases) |
2,334 | 2,334 | ||||
| Unrealized
gains on derivative financial instruments — trading |
3,243 | 3,243 | ||||
| Unrealized
gains on derivative financial instruments — asset and liability management |
70 | 70 | ||||
| Financial
Liabilities: |
||||||
| Long-term
debt |
2,458 | 2,588 | ||||
| Unrealized
losses on derivative financial instruments — trading |
3,131 | 3,131 | ||||
| Unrealized
losses on derivative financial instruments — asset and liability
management |
146 | 146 | ||||
| STATEMENT OF INCOME |
||||||||||||||
|---|---|---|---|---|---|---|---|---|---|---|---|---|---|---|
| 2005 |
2004 |
2003 |
||||||||||||
| (Dollars
in millions) |
||||||||||||||
| Years
ended December 31, |
||||||||||||||
| Interest
on securities purchased under resale agreements |
$ | 332 | $ | 140 | $ | 93 | ||||||||
| Cash
dividends from consolidated bank subsidiary |
570 | 400 | 145 | |||||||||||
| Cash
dividends from consolidated non-bank subsidiaries and unconsolidated affiliates |
74 | 50 | 52 | |||||||||||
| Other,
net |
42 | 28 | 33 | |||||||||||
| Total
revenue |
1,018 | 618 | 323 | |||||||||||
| Interest
on securities sold under repurchase agreements |
265 | 112 | 75 | |||||||||||
| Other
interest expense |
131 | 78 | 77 | |||||||||||
| Other
expenses |
6 | 11 | 12 | |||||||||||
| Total
expenses |
402 | 201 | 164 | |||||||||||
| Income
tax expense (benefit) |
33 | 11 | (1 | ) | ||||||||||
| Income
before equity in undistributed income of subsidiaries and affiliates |
583 | 406 | 160 | |||||||||||
| Equity
in undistributed income of subsidiaries and affiliates: |
||||||||||||||
| Consolidated
bank subsidiary |
165 | 338 | 541 | |||||||||||
| Consolidated
non-bank subsidiaries and unconsolidated affiliates |
90 | 54 | 21 | |||||||||||
| Net
income |
$ | 838 | $ | 798 | $ | 722 | ||||||||
| STATEMENT OF CONDITION |
||||||||
|---|---|---|---|---|---|---|---|---|
| 2005 |
2004 |
|||||||
| (Dollars
in millions) |
||||||||
| As
of December 31, |
||||||||
| Assets: |
||||||||
| Interest-bearing deposits with bank subsidiary |
$ | 550 | $ | 1,130 | ||||
| Securities
purchased under resale agreements from: |
||||||||
| External
parties |
8,464 | 1,901 | ||||||
| Consolidated
non-bank subsidiary and unconsolidated affiliates |
615 | 333 | ||||||
| Investment
securities available for sale |
91 | 101 | ||||||
| Investments
in subsidiaries: |
||||||||
| Consolidated
bank subsidiary |
6,139 | 6,262 | ||||||
| Consolidated
non-bank subsidiaries |
983 | 898 | ||||||
| Unconsolidated affiliates |
164 | 158 | ||||||
| Notes
and other receivables from: |
||||||||
| Consolidated
bank subsidiary |
19 | 50 | ||||||
| Consolidated
non-bank subsidiaries and affiliates |
71 | 88 | ||||||
| Other
assets |
70 | 83 | ||||||
| Total
assets |
$ | 17,166 | $ | 11,004 | ||||
| Liabilities: |
||||||||
| Securities
sold under repurchase agreements |
$ | 8,624 | $ | 2,118 | ||||
| Commercial
paper |
864 | 966 | ||||||
| Accrued
taxes, expenses and other liabilities due to: |
||||||||
| Consolidated
bank subsidiary |
33 | 109 | ||||||
| Consolidated
non-bank subsidiaries |
7 | 10 | ||||||
| External
parties |
148 | 167 | ||||||
| Long-term
debt |
1,123 | 1,475 | ||||||
| Total
liabilities |
10,799 | 4,845 | ||||||
| Shareholders’ equity |
6,367 | 6,159 | ||||||
| Total
liabilities and shareholders’ equity |
$ | 17,166 | $ | 11,004 | ||||
| STATEMENT OF CASH FLOWS |
||||||||||||
|---|---|---|---|---|---|---|---|---|---|---|---|---|
| 2005 |
2004 |
2003 |
||||||||||
| (Dollars
in millions) |
||||||||||||
| Years
ended December 31, |
||||||||||||
| Net
Cash Provided by Operating Activities |
$ | 512 | $ | 412 | $ | 167 | ||||||
| Investing
Activities: |
||||||||||||
| Net
decrease (increase) in interest-bearing deposits with bank subsidiary |
580 | (327 | ) | (286 | ) | |||||||
| Net
(increase) decrease in securities purchased under resale agreements |
(6,845 | ) | 5,154 | (1,509 | ) | |||||||
| Purchases
of available-for-sale securities |
(378 | ) | (43 | ) | (23 | ) | ||||||
| Sales
of available-for-sale securities |
385 | 43 | – | |||||||||
| Investments
in consolidated bank subsidiary |
– | – | (320 | ) | ||||||||
| Investments
in non-bank subsidiaries and affiliates |
(20 | ) | (75 | ) | (272 | ) | ||||||
| Net
decrease in notes receivable from subsidiaries |
15 | 26 | 56 | |||||||||
| Other |
12 | 13 | 12 | |||||||||
| Net
cash (used) provided by investing activities |
(6,251 | ) | 4,791 | (2,342 | ) | |||||||
| Financing
Activities: |
||||||||||||
| Net
increase (decrease) in short-term borrowings |
6,506 | (4,914 | ) | 1,755 | ||||||||
| Net
decrease in commercial paper |
(102 | ) | (15 | ) | (17 | ) | ||||||
| Proceeds
from issuance of long-term debt, net of issuance costs |
– | – | 343 | |||||||||
| Repayments
of long-term debt |
(345 | ) | – | (100 | ) | |||||||
| Proceeds
from SPACES, net of issuance costs |
345 | – | 257 | |||||||||
| Purchases
of common stock |
(664 | ) | (178 | ) | (3 | ) | ||||||
| Proceeds
from issuance of treasury stock for stock awards and options exercised |
231 | 113 | 119 | |||||||||
| Payments
for cash dividends |
(232 | ) | (209 | ) | (179 | ) | ||||||
| Net
cash provided (used) by financing activities |
5,739 | (5,203 | ) | 2,175 | ||||||||
| Net
change |
– | – | – | |||||||||
| Cash
and due from banks at beginning of year |
– | – | – | |||||||||
| Cash
and due from banks at end of year |
$ | – | $ | – | $ | – | ||||||
| 2005 |
2004 |
2003 |
||||||||||||||||||||||||||||||||||
|---|---|---|---|---|---|---|---|---|---|---|---|---|---|---|---|---|---|---|---|---|---|---|---|---|---|---|---|---|---|---|---|---|---|---|---|---|
| Average Balance |
Interest |
Average Rate |
Average Balance |
Interest |
Average Rate |
Average Balance |
Interest |
Average Rate |
||||||||||||||||||||||||||||
| (Dollars
in millions; taxable equivalent) |
||||||||||||||||||||||||||||||||||||
| Years
ended December 31, |
||||||||||||||||||||||||||||||||||||
| Assets: |
||||||||||||||||||||||||||||||||||||
| Interest-bearing deposits with non-U.S. banks |
$ | 17,186 | $ | 527 | 3.07 | % | $ | 27,221 | $ | 589 | 2.17 | % | $ | 22,452 | $ | 473 | 2.11 | % | ||||||||||||||||||
| Interest-bearing deposits with U.S. banks |
74 | 2 | 2.60 | 167 | 2 | .94 | 86 | 1 | .56 | |||||||||||||||||||||||||||
| Securities
purchased under resale agreements |
12,579 | 403 | 3.21 | 13,733 | 191 | 1.39 | 13,152 | 164 | 1.25 | |||||||||||||||||||||||||||
| Federal
funds sold |
311 | 9 | 2.82 | 359 | 5 | 1.29 | 393 | 4 | 1.12 | |||||||||||||||||||||||||||
| Trading
account assets(2) |
470 | 21 | 4.39 | 614 | 14 | 2.36 | 819 | 19 | 2.37 | |||||||||||||||||||||||||||
| Investment
securities: |
||||||||||||||||||||||||||||||||||||
| U.S.
Treasury and federal agencies |
24,833 | 866 | 3.49 | 22,314 | 536 | 2.40 | 19,815 | 409 | 2.06 | |||||||||||||||||||||||||||
| State
and political subdivisions(2) |
1,839 | 78 | 4.23 | 1,945 | 77 | 3.93 | 1,912 | 86 | 4.47 | |||||||||||||||||||||||||||
| Other
investments |
24,481 | 873 | 3.56 | 11,834 | 277 | 2.31 | 9,377 | 259 | 2.70 | |||||||||||||||||||||||||||
| Commercial
and financial loans |
3,718 | 106 | 2.85 | 3,433 | 59 | 1.72 | 3,402 | 61 | 1.79 | |||||||||||||||||||||||||||
| Lease
financing(2) |
2,295 | 87 | 3.81 | 2,256 | 82 | 3.61 | 2,166 | 114 | 5.26 | |||||||||||||||||||||||||||
| Total
interest-earning assets(2) |
87,786 | 2,972 | 3.39 | 83,876 | 1,832 | 2.18 | 73,574 | 1,590 | 2.16 | |||||||||||||||||||||||||||
| Cash
and due from banks |
2,598 | 2,853 | 1,596 | |||||||||||||||||||||||||||||||||
| Other
assets |
9,385 | 8,413 | 7,503 | |||||||||||||||||||||||||||||||||
| Total
assets |
$ | 99,769 | $ | 95,142 | $ | 82,673 | ||||||||||||||||||||||||||||||
| Liabilities
and Shareholders’ Equity: |
||||||||||||||||||||||||||||||||||||
| Interest-bearing deposits: |
||||||||||||||||||||||||||||||||||||
| Time |
$ | 2,058 | 66 | 3.19 | $ | 5,352 | 72 | 1.35 | $ | 4,731 | 59 | 1.22 | ||||||||||||||||||||||||
| Savings |
934 | 21 | 2.28 | 855 | 6 | .72 | 1,079 | 6 | .57 | |||||||||||||||||||||||||||
| Non-U.S. |
46,711 | 1,045 | 2.24 | 39,046 | 434 | 1.11 | 29,746 | 307 | 1.04 | |||||||||||||||||||||||||||
| Total
interest-bearing deposits |
49,703 | 1,132 | 2.28 | 45,253 | 512 | 1.13 | 35,556 | 372 | 1.05 | |||||||||||||||||||||||||||
| Securities
sold under repurchase agreements |
22,432 | 613 | 2.73 | 22,989 | 234 | 1.02 | 22,724 | 205 | .90 | |||||||||||||||||||||||||||
| Federal
funds purchased |
2,306 | 75 | 3.23 | 2,891 | 41 | 1.40 | 2,901 | 33 | 1.13 | |||||||||||||||||||||||||||
| Other
short-term borrowings |
1,970 | 65 | 3.30 | 1,736 | 40 | 2.28 | 2,031 | 41 | 2.03 | |||||||||||||||||||||||||||
| Long-term
debt |
2,461 | 138 | 5.63 | 2,319 | 101 | 4.36 | 1,810 | 78 | 4.31 | |||||||||||||||||||||||||||
| Total
interest-bearing liabilities |
78,872 | 2,023 | 2.57 | 75,188 | 928 | 1.23 | 65,022 | 729 | 1.12 | |||||||||||||||||||||||||||
| Noninterest-bearing deposits: |
||||||||||||||||||||||||||||||||||||
| Special
time |
6,880 | 6,697 | 6,607 | |||||||||||||||||||||||||||||||||
| Demand |
1,243 | 1,296 | 717 | |||||||||||||||||||||||||||||||||
| Non-U.S.(3) |
170 | 53 | 35 | |||||||||||||||||||||||||||||||||
| Other
liabilities |
6,426 | 5,900 | 5,090 | |||||||||||||||||||||||||||||||||
| Shareholders’ equity |
6,178 | 6,008 | 5,202 | |||||||||||||||||||||||||||||||||
| Total
liabilities and shareholders’ equity |
$ | 99,769 | $ | 95,142 | $ | 82,673 | ||||||||||||||||||||||||||||||
| Net
interest revenue |
$ | 949 | $ | 904 | $ | 861 | ||||||||||||||||||||||||||||||
| Excess
of rate earned over rate paid |
.82 | % | .95 | % | 1.04 | % | ||||||||||||||||||||||||||||||
| Net
interest margin(1) |
1.08 | 1.08 | 1.17 | |||||||||||||||||||||||||||||||||
(1) |
Net interest margin is taxable-equivalent net interest revenue divided by average interest-earning assets. |
(2) |
Taxable-equivalent adjusted revenue is a method of presentation in which the tax savings achieved by investing in tax-exempt securities are included in interest income with a corresponding charge to income tax expense. This method provides better comparability between the performance of tax-exempt and taxable securities. The adjustment is computed using a federal income tax rate of 35%, adjusted for applicable state income taxes, net of the related federal-tax benefit. The taxable-equivalent adjustments included in interest revenue above were $42 million, $45 million and $51 million for the years ended December 31, 2005, 2004 and 2003, respectively. |
(3) |
Non-U.S. noninterest-bearing deposits were $122 million, $71 million and $53 million at December 31, 2005, 2004 and 2003, respectively. |
| 2005 Compared to 2004 |
2004
Compared to 2003 |
|||||||||||||||||||||||
|---|---|---|---|---|---|---|---|---|---|---|---|---|---|---|---|---|---|---|---|---|---|---|---|---|
| Change
in Volume |
Change
in Rate |
Net
(Decrease) Increase |
Change
in Volume |
Change
in Rate |
Net
Increase (Decrease) |
|||||||||||||||||||
| (Dollars
in millions; taxable equivalent) |
||||||||||||||||||||||||
| Years
ended December 31, |
||||||||||||||||||||||||
| Interest
Revenue Related to: |
||||||||||||||||||||||||
| Interest-bearing deposits with non-U.S. banks |
$ | (219 | ) | $ | 157 | $ | (62 | ) | $ | 100 | $ | 16 | $ | 116 | ||||||||||
| Interest-bearing deposits with U.S. banks |
– | – | – | 1 | – | 1 | ||||||||||||||||||
| Securities
purchased under resale agreements |
(16 | ) | 228 | 212 | 7 | 20 | 27 | |||||||||||||||||
| Federal
funds sold |
(1 | ) | 5 | 4 | – | 1 | 1 | |||||||||||||||||
| Trading
account assets |
(3 | ) | 10 | 7 | (5 | ) | – | (5 | ) | |||||||||||||||
| Investment
securities: |
||||||||||||||||||||||||
| U.S.
Treasury and federal agencies |
60 | 270 | 330 | 51 | 76 | 127 | ||||||||||||||||||
| State
and political subdivisions |
(4 | ) | 5 | 1 | 1 | (10 | ) | (9 | ) | |||||||||||||||
| Other
investments |
296 | 300 | 596 | 68 | (50 | ) | 18 | |||||||||||||||||
| Commercial
and financial loans |
5 | 42 | 47 | 1 | (3 | ) | (2 | ) | ||||||||||||||||
| Lease
financing |
1 | 4 | 5 | 5 | (37 | ) | (32 | ) | ||||||||||||||||
| Total
interest-earning assets |
119 | 1,021 | 1,140 | 229 | 13 | 242 | ||||||||||||||||||
| Interest
Expense Related to: |
||||||||||||||||||||||||
| Deposits: |
||||||||||||||||||||||||
| Time |
(44 | ) | 38 | (6 | ) | 6 | 7 | 13 | ||||||||||||||||
| Savings |
1 | 14 | 15 | (1 | ) | 1 | – | |||||||||||||||||
| Non-U.S. |
85 | 526 | 611 | 99 | 28 | 127 | ||||||||||||||||||
| Securities
sold under repurchase agreements |
(5 | ) | 384 | 379 | 2 | 27 | 29 | |||||||||||||||||
| Federal
funds purchased |
(8 | ) | 42 | 34 | – | 8 | 8 | |||||||||||||||||
| Other
short-term borrowings |
5 | 20 | 25 | (5 | ) | 4 | (1 | ) | ||||||||||||||||
| Long-term
debt |
6 | 31 | 37 | 22 | 1 | 23 | ||||||||||||||||||
| Total
interest-bearing liabilities |
40 | 1,055 | 1,095 | 123 | 76 | 199 | ||||||||||||||||||
| Net
interest revenue |
$ | 79 | $ | (34 | ) | $ | 45 | $ | 106 | $ | (63 | ) | $ | 43 | ||||||||||
| 2005 Quarters |
2004
Quarters |
|||||||||||||||||||||||||||||||
|---|---|---|---|---|---|---|---|---|---|---|---|---|---|---|---|---|---|---|---|---|---|---|---|---|---|---|---|---|---|---|---|---|
| Fourth |
Third |
Second |
First |
Fourth |
Third |
Second |
First |
|||||||||||||||||||||||||
| (Dollars
and shares in millions, except per share data) |
||||||||||||||||||||||||||||||||
| Consolidated
Statement of Income: |
||||||||||||||||||||||||||||||||
| Total fee
revenue |
$ | 1,176 | $ | 1,135 | $ | 1,143 | $ | 1,097 | $ | 1,029 | $ | 961 | $ | 1,045 | $ | 1,013 | ||||||||||||||||
| |
||||||||||||||||||||||||||||||||
| Interest
revenue |
861 | 773 | 693 | 603 | 532 | 463 | 408 | 384 | ||||||||||||||||||||||||
| Interest
expense |
619 | 537 | 476 | 391 | 315 | 250 | 182 | 181 | ||||||||||||||||||||||||
| Net
interest revenue |
242 | 236 | 217 | 212 | 217 | 213 | 226 | 203 | ||||||||||||||||||||||||
| Provision
for loan losses |
– | – | – | – | (18 | ) | – | – | – | |||||||||||||||||||||||
| Net
interest revenue after provision for loan losses |
242 | 236 | 217 | 212 | 235 | 213 | 226 | 203 | ||||||||||||||||||||||||
| (Losses)
gains on sales of available- for-sale securities, net |
(2 | ) | 1 | 1 | (1 | ) | 7 | – | 16 | 3 | ||||||||||||||||||||||
| Gain
on sales of divested businesses, net |
– | 16 | – | – | – | – | – | – | ||||||||||||||||||||||||
| Total
revenue |
1,416 | 1,388 | 1,361 | 1,308 | 1,271 | 1,174 | 1,287 | 1,219 | ||||||||||||||||||||||||
| Total
operating expenses |
1,039 | 1,008 | 1,028 | 966 | 992 | 906 | 953 | 908 | ||||||||||||||||||||||||
| Income
from continuing operations before income taxes |
377 | 380 | 333 | 342 | 279 | 268 | 334 | 311 | ||||||||||||||||||||||||
| Income
tax expense from continuing operations |
128 | 130 | 113 | 116 | 95 | 91 | 114 | 94 | ||||||||||||||||||||||||
| Income from continuing operations |
249 | 250 | 220 | 226 | 184 | 177 | 220 | 217 | ||||||||||||||||||||||||
| Net
loss from discontinued operations |
– | (107 | ) | – | – | – | – | – | – | |||||||||||||||||||||||
| Net
income |
$ | 249 | $ | 143 | $ | 220 | $ | 226 | $ | 184 | $ | 177 | $ | 220 | $ | 217 | ||||||||||||||||
| Earnings
Per Share From Continuing Operations: |
||||||||||||||||||||||||||||||||
| Basic |
$ | .75 | $ | .76 | $ | .67 | $ | .68 | $ | .55 | $ | .52 | $ | .66 | $ | .65 | ||||||||||||||||
| Diluted |
.74 | .75 | .66 | .67 | .55 | .52 | .65 | .63 | ||||||||||||||||||||||||
| Loss
Per Share From Discontinued Operations: |
||||||||||||||||||||||||||||||||
| Basic |
$ | – | $ | (.33 | ) | $ | – | $ | – | $ | – | $ | – | $ | – | $ | – | |||||||||||||||
| Diluted |
– | (.32 | ) | – | – | – | – | – | – | |||||||||||||||||||||||
| Earnings
Per Share: |
||||||||||||||||||||||||||||||||
| Basic |
$ | .75 | $ | .43 | $ | .67 | $ | .68 | $ | .55 | $ | .52 | $ | .66 | $ | .65 | ||||||||||||||||
| Diluted |
.74 | .43 | .66 | .67 | .55 | .52 | .65 | .63 | ||||||||||||||||||||||||
| Average
Shares Outstanding: |
||||||||||||||||||||||||||||||||
| Basic |
331 | 329 | 330 | 332 | 333 | 336 | 335 | 335 | ||||||||||||||||||||||||
| Diluted |
337 | 334 | 334 | 335 | 337 | 339 | 341 | 342 | ||||||||||||||||||||||||
| Dividends
per share |
$ | .19 | $ | .18 | $ | .18 | $ | .17 | $ | .17 | $ | .16 | $ | .16 | $ | .15 | ||||||||||||||||
| Stock
price: |
||||||||||||||||||||||||||||||||
| High |
59.80 | 51.50 | 51.93 | 49.25 | 49.25 | 50.12 | 54.39 | 56.90 | ||||||||||||||||||||||||
| Low |
48.47 | 47.20 | 40.62 | 42.60 | 39.91 | 41.59 | 45.39 | 49.00 | ||||||||||||||||||||||||
| Close |
55.44 | 48.92 | 48.25 | 43.72 | 49.12 | 42.71 | 49.04 | 52.13 | ||||||||||||||||||||||||
ITEM 9. |
CHANGES IN AND DISAGREEMENTS WITH ACCOUNTANTS ON ACCOUNTING AND FINANCIAL DISCLOSURE |
STATE STREET CORPORATION
February 17, 2006
ITEM 12. |
SECURITY OWNERSHIP OF CERTAIN BENEFICIAL OWNERS AND MANAGEMENT AND RELATED STOCKHOLDER MATTERS |
| Consolidated Statement of Changes in Shareholders’ Equity — Years ended December 31, 2005, 2004 and 2003 |
| 2.1 | Sale
and Purchase Agreement between Deutsche Bank AG and State Street Corporation dated as of November 5, 2002, as amended by Amendment No. 1 thereto dated
January 31, 2003, and by Amendment No. 2 thereto dated as of January 31, 2003 (filed as Exhibit 99.2 to Registrant’s Current Report on Form 8-K
dated January 31, 2003, and incorporated herein by reference) |
|||||
| 3.1 | Restated Articles of Organization, as amended (filed as Exhibit 3.1 to Registrant’s Quarterly Report on Form 10-Q for the quarter ended
June 30, 2001 and incorporated herein by reference) |
|||||
| 3.2 | By-laws, as amended (filed as Exhibit 3.1 to Registrant’s Annual Report on Form 10-K for the year ended December 31, 2004 and
incorporated herein by reference) |
|||||
| 4.1 | The
description of the Registrant’s Common Stock is included in the Registrant’s Registration Statement on Forms 8-A, as filed on January 18,
1995 and March 7, 1995, as supplemented by the description of the Registrant’s Preferred Stock Purchase Rights attached to the Common Stock
included in the Registrant’s Registration Statement on Forms 8-A (filed on January 18, 1995 and March 7, 1995 and as updated by Form 8-A/A filed
on July 7, 1998, and incorporated herein by reference) |
|||||
| 4.2 | Amended and Restated Rights Agreement dated as of June 18, 1998 between Registrant and Bank Boston N.A., as Rights Agent (filed as Exhibit
99.1 to Registrant’s Current Report on Form 8-K dated June 18, 1998 and incorporated herein by reference) |
|||||
| 4.3 | Certificate of Designation, Preference and Rights (filed as Exhibit 3.1 to Registrant’s Annual Report on Form 10-K for the year ended
December 31, 1991 and incorporated herein by reference) |
|||||
| 4.4 | Indenture dated as of May 1, 1983 between Registrant and Morgan Guaranty Trust Company of New York, Trustee, relating to Registrant’s
7-3/4% Convertible Subordinated Debentures due 2008 (filed as Exhibit 4 to Registrant’s Registration Statement on Form S-3 (Commission File No.
2-83251) and incorporated herein by reference) |
|||||
| 4.5 | Indenture dated as of August 2, 1993 between Registrant and The First National Bank of Boston, as trustee relating to Registrant’s
long-term notes (filed as Exhibit 4 to Registrant’s Current Report on Form 8-K dated October 8, 1993 and incorporated herein by
reference) |
|||||
| 4.6 | Instrument of Resignation, Appointment, and Acceptance, dated as of February 14, 1996 among Registrant, The First National Bank of Boston
(resigning trustee) and Fleet National Bank of Massachusetts (successor trustee) (filed as Exhibit 4.6 to Registrant’s Annual Report on Form 10-K
for the year ended December 31, 1995 and incorporated herein by reference) |
|||||
| 4.7 | Instrument of Resignation, Appointment and Acceptance dated as of June 26, 1997 among the Registrant, Fleet National Bank (resigning trustee)
and First Trust National Association (now known as U.S. Bank National Association) (successor trustee) (filed as Exhibit 4.13 to Registrant’s
Annual Report on Form 10-K for the year ended December 31, 1997 and incorporated herein by reference) |
|||||
| 4.8 | Junior Subordinated Indenture dated as of December 15, 1996 between Registrant and Bank One Trust Company, N.A. (as successor in interest to
The First National Bank of Chicago), as trustee (filed as Exhibit 1 to Registrant’s Current Report on Form 8-K dated February 27, 1997 and
incorporated herein by reference) |
|||||
| 4.9 | First Supplemental Indenture dated as of January 21, 2003 to the Junior Subordinated Indenture as of December 15, 1996 between Registrant and
Bank One Trust Company, N.A., as trustee (filed as Exhibit 4.27 to Registrant’s Current Report on Form 8-K dated January 21, 2003 and incorporated
herein by reference) |
|||||
| 4.10 | Amended and Restated Trust Agreement dated as of December 15, 1996 relating to State Street Institutional Capital A (filed as Exhibit 2 to
Registrant’s Current Report on Form 8-K dated February 27, 1997 and incorporated herein by reference) |
|||||
| 4.11 | Capital Securities Guarantee Agreement dated as of December 15, 1996 between Registrant and Bank One Trust Company, N.A. (as successor in
interest to The First National Bank of Chicago) (filed as Exhibit 3 to Registrant’s Current Report on Form 8-K dated February 27, 1997 and
incorporated herein by reference) |
|||||
| 4.12 | Amended and Restated Trust Agreement, dated March 11, 1997 relating to State Street Institutional Capital B (filed as Exhibit 2 to
Registrant’s Current Report on Form 8-K dated April 17, 1997 and incorporated herein by reference) |
|||||
| 4.13 | Capital Securities Guarantee Agreement dated March 11, 1997 between Registrant and Bank One Trust Company, N.A. (as successor in interest to
The First National Bank of Chicago) (filed as Exhibit 3 to Registrant’s Current Report on Form 8-K dated April 17, 1997 and incorporated herein by
reference) |
|||||
| 4.14 | Indenture dated as of June 15, 2000 between Registrant and Bank One Trust Company, N.A., as trustee (filed as Exhibit 4.26 to Post-Effective
Amendment No. 1 to Registrant’s Registration Statement on Form S-3 filed on June 20, 2000, Commission File No. 333-34516, and incorporated herein
by reference) |
|||||
| 4.15 | Certificate of Trust of State Street Capital Trust II, as filed with the Delaware Secretary of State on March 25, 1998 (filed as Exhibit 4.18
to Registrant’s Registration Statement on Form S-3 filed on April 1, 1998, Commission File No. 333-49143, and incorporated herein by
reference) |
|||||
| 4.16 | Certificate of Trust of State Street Capital Trust III, as filed with the Delaware Secretary of State on March 25, 1998 (filed as Exhibit 4.19
to Registrant’s Registration Statement on Form S-3 filed on April 1, 1998, Commission File No. 333-49143, and incorporated herein by
reference) |
|||||
| 4.17 | Certificate of Trust of State Street Capital Trust IV, as filed with the Delaware Secretary of State on March 31, 2000 (filed as Exhibit 4.19
to Registrant’s Registration Statement on Form S-3 filed on April 11, 2000, Commission File No. 333-34516, and incorporated herein by
reference) |
|||||
| 4.18 | Declaration of Trust of State Street Capital Trust II among Registrant, as Depositor, Bank One Trust Company, N.A. (as successor in interest
to The First National Bank of Chicago), as Property Trustee, Bank One Delaware, Inc., as Delaware Trustee, and the Administrative Trustees named
therein (filed as Exhibit 4.21 to Registrant’s Registration Statement on Form S-3 filed on April 1, 1998, Commission File No. 333-49143, and
incorporated herein by reference) |
|||||
| 4.19 | Declaration of Trust of State Street Capital Trust III among Registrant, as Depositor, Bank One Trust Company, N.A. (as successor in interest
to The First National Bank of Chicago), as Property Trustee, Bank One Delaware, Inc., as Delaware Trustee, and the Administrative Trustees named
therein (filed as Exhibit 4.22 to Registrant’s Registration Statement on Form S-3 filed on April 1, 1998, Commission File No. 333-49143, and
incorporated herein by reference) |
|||||
| 4.20 | Declaration of Trust of State Street Capital Trust IV among Registrant, as Depositor, Bank One Trust Company, N.A., as Property Trustee, Bank
One Delaware, Inc., as Delaware Trustee, and the Administrative Trustees named therein (filed as Exhibit 4.22 to Registrant’s Registration
Statement on Form S-3 filed on April 11, 2000, Commission File No. 333-34516, and incorporated herein by reference) |
|||||
| 4.21 | Form
of Amended and Restated Trust Agreement for each of State Street Capital Trust II, State Street Capital Trust III, and State Street Capital Trust IV
among Registrant, as Depositor, Bank One Trust Company, N.A. (where applicable, as successor in interest to The First National Bank of Chicago), as
Property Trustee, Bank One Delaware, Inc., as Delaware Trustee, and the Administrative Trustees named therein (filed as Exhibit 4.23 to
Registrant’s Registration Statement on Form S-3 filed on April 11, 2000, Commission File No. 333-34516, and incorporated herein by
reference) |
|||||
| 4.22 | Form
of Guarantee Agreement for each of State Street Capital Trust II, State Street Capital Trust III and State Street Capital Trust IV between Registrant,
as guarantor, and Bank One Trust Company, N.A. (where applicable, as successor in interest to The First National Bank of Chicago), as trustee (filed as
Exhibit 4.25 to Registrant’s Registration Statement on Form S-3 filed on April 11, 2000, Commission File No. 333-34516, and incorporated herein by
reference) |
|||||
(Note: Registrant agrees to furnish to the Securities and Exchange Commission upon request a copy of any other instrument with respect to long-term debt of the Registrant and its subsidiaries. Such other instruments are not filed herewith since no such instrument relates to outstanding debt in an amount greater than 10% of the total assets of Registrant and its subsidiaries on a consolidated basis) |
||||||
| 10.1† | Registrant’s Supplemental Executive Retirement Plan, together with individual benefit agreements (filed as Exhibit 10.1 to
Registrant’s Annual Report on Form 10-K for the year ended December 31, 1991 and incorporated herein by reference) |
|||||
| 10.1A† | Amendment No. 1 dated as of October 19, 1995, to Registrant’s Supplemental Executive Retirement Plan (filed as Exhibit 10.6A to
Registrant’s Annual Report on Form 10-K for the year ended December 31, 1995 and incorporated herein by reference) |
|||||
| 10.2† | Registrant’s 1994 Stock Option and Performance Unit Plan (filed as Exhibit 10.17 to Registrant’s Annual Report on Form 10-K for the
year ended December 31, 1993 and incorporated herein by reference) |
|||||
| 10.2A† | Amendment No. 1 dated as of October 19, 1995 to Registrant’s 1994 Stock Option and Performance Unit Plan (filed as Exhibit 10.13A to
Registrant’s Annual Report on Form 10-K for the year ended December 31, 1995 and incorporated herein by reference) |
|||||
| 10.2B† | Amendment No. 2 dated as of June 20, 1996 to Registrant’s 1994 Stock Option and Performance Unit Plan (filed as Exhibit 10.7B to
Registrant’s Annual Report on Form 10-K for the year ended December 31, 1998 and incorporated herein by reference) |
|||||
| 10.2C† | Amendment No. 3 dated as of June 28, 2000 to Registrant’s 1994 Stock Option and Performance Unit Plan, as amended (filed as Exhibit 10.1
to Registrant’s Quarterly Report on Form 10-Q for the quarter ended June 30, 2000 and incorporated herein by reference) |
|||||
| 10.3† | Registrant’s Amended and Restated Supplemental Defined Benefit Pension Plan for Senior Executive Officers (filed as Exhibit 10.1 to
Registrant’s Quarterly Report on Form 10-Q for the quarter ended March 3, 2004 and incorporated herein by reference) |
|||||
| 10.3A† | Schedule B to Amended and Restated Supplemental Defined Benefit Pension Plan for Senior Executive Officers as applicable to J.
Hooley |
|||||
| 10.4† | State Street Global Advisors Incentive Plan for 1996 (filed as Exhibit 10.19 to Registrant’s Annual Report on Form 10-K for the year
ended December 31, 1995 and incorporated herein by reference) |
|||||
| 10.5† | Forms of Employment Agreement with Officers (Levels 1, 2, and 3) approved by the Board of Directors on September 1995 (filed as Exhibit 10.20
to Registrant’s Annual Report on Form 10-K for the year ended December 31, 1995 and incorporated herein by reference) |
|||||
| 10.6† | State Street Global Advisors Equity Compensation Plan (filed as Exhibit 10 to Registrant’s Form 10-Q for the quarter ended September 30,
1996 and incorporated herein by reference) |
|||||
| 10.7† | Registrant’s Senior Executive Annual Incentive Plan (filed as Exhibit 10.10 to Registrant’s Annual Report on Form 10-K for the year
ended December 31, 2001 and incorporated herein by reference) |
|||||
| 10.8† | Registrant’s Executive Compensation Trust Agreement dated December 6, 1996 (Rabbi Trust) (filed as Exhibit 10.18 to Registrant’s
Annual Report on Form 10-K for the year ended December 31, 1996 and incorporated herein by reference) |
|||||
| 10.9† | Registrant’s 1997 Equity Incentive Plan (filed as Exhibit 10.22 to Registrant’s Form 10-Q for the quarter ended June 30, 1997 and
incorporated herein by reference) |
|||||
| 10.9A† | Amendment No. 2 to Registrant’s 1997 Equity Incentive Plan (filed as Exhibit 10.17 to Registrant’s Annual Report on Form 10-K for
the year ended December 31, 1997 and incorporated herein by reference) |
|||||
| 10.9B† | Amendment No. 3 dated as of April 24, 2000 to Registrant’s 1997 Equity Incentive Plan, as amended (filed as Exhibit 10.1 to
Registrant’s Quarterly Report on Form 10-Q for the quarter ended March 31, 2000 and incorporated herein by reference) |
|||||
| 10.9C† | Amendment No. 4 dated as of June 28, 2000 to Registrant’s 1997 Equity Incentive Plan, as amended (filed as Exhibit 10.2 to
Registrant’s Quarterly Report on Form 10-Q for the quarter ended June 30, 2000 and incorporated herein by reference) |
|||||
| 10.9D† | Amendment No. 5 dated as of December 20, 2001 to Registrant’s 1997 Equity Incentive Plan, as amended (filed as Exhibit 12D to
Registrant’s Annual Report on Form 10-K for the year ended December 31, 2001 and incorporated herein by reference) |
|||||
| 10.9E† | Form
of Performance Award agreement under the 1997 Equity Incentive Plan (filed as Exhibit 10.1 to Registrant’s Quarterly Report on Form 10-Q for the
quarter ended September 30, 2004 and incorporated herein by reference) |
|||||
| 10.9F† | Form
of Performance Award deferral election agreement under the 1997 Equity Incentive Plan (filed as Exhibit 10.2 to Registrant’s Quarterly Report on
Form 10-Q for the quarter ended September 30, 2004 and incorporated herein by reference) |
|||||
| 10.9G† | Form
of Non-Qualified Stock Option Award agreement under the 1997 Equity Incentive Plan (filed as Exhibit 10.3 to Registrant’s Quarterly Report on Form
10-Q for the quarter ended September 30, 2004 and incorporated herein by reference) |
|||||
| 10.9H† | Form
of Incentive Stock Option Award agreement under the 1997 Equity Incentive Plan (filed as Exhibit 10.4 to Registrant’s Quarterly Report on Form
10-Q for the quarter ended September 30, 2004 and incorporated herein by reference) |
|||||
| 10.9I† | Form
of Restrictive Stock Award agreement under the 1997 Equity Incentive Plan (filed as Exhibit 10.5 to Registrant’s Quarterly Report on Form 10-Q for
the quarter ended September 30, 2004 and incorporated herein by reference) |
|||||
| 10.9J† | Form
of Deferred Stock Award Agreement under the 1997 Equity Incentive Plan (filed as Exhibit 10.6 to Registrant’s Quarterly Report on Form 10-Q for
the quarter ended September 30, 2004 and incorporated herein by reference) |
|||||
| 10.9K† | Form
of Performance-Based Equity Award to SSgA employees under the 1997 Equity Incentive Plan (filed as Exhibit 10.7 to Registrant’s Quarterly Report
on Form 10-Q for the quarter ended September 30, 2004 and incorporated herein by reference) |
|||||
| 10.9L† | Form
of Deferred Stock Award to Non-Employee Directors under the 1997 Equity Incentive Plan (filed as Exhibit 10.12L to Registrant’s Annual Report on
Form 10-K for the year ended December 31, 2004 and incorporated herein by reference) |
|||||
| 10.10† | Description of compensation arrangements for non-employee directors (filed as Exhibit 10.13G to Registrant’s Annual Report on Form 10-K
for the year ended December 31, 2004 and incorporated herein by reference) |
|||||
| 10.11† | Amended and Restated Deferred Compensation Plan for Directors of State Street Corporation (filed as Exhibit 10.1 to Registrant’s
Quarterly Report on Form 10-Q for the quarter ended March 31, 1999 and incorporated herein by reference) |
|||||
| 10.12† | Amended and Restated Deferred Compensation Plan for Directors of State Street Bank and Trust Company (filed as Exhibit 10.2 to
Registrant’s Quarterly Report on Form 10-Q for the quarter ended March 31, 1999 and incorporated herein by reference) |
|||||
| 10.13† | Registrant’s 401(k) Restoration and Voluntary Deferral Plan (filed as Exhibit 10 to Registrant’s Quarterly Report on Form 10-Q for
the quarter ended June 30, 2000 and incorporated herein by reference) |
|||||
| 10.14† | Registrant’s Savings-Related Stock Plan for United Kingdom employees (filed as Exhibit 99.1 to Registrant’s Registration Statement
on Form S-8 filed on September 23, 2002, Commission File No. 333-100001, and incorporated herein by reference) |
|||||
| 10.15† | Memorandum of Agreement with Nicholas A. Lopardo (filed as Exhibit 10.1 to Registrant’s Quarterly Report on Form 10-Q for the quarter
ended September 30, 2001 and incorporated herein by reference) |
|||||
| 10.16† | Memorandum of agreement of employment of Edward J. Resch, accepted October 16, 2002 (filed as Exhibit 10.23 to Registrant’s Annual Report
on Form 10-K for the year ended December 31, 2002 and incorporated herein by reference) |
|||||
| 10.17† | Memorandum of Agreement with Maureen Scannell Bateman supplemental to an Executive Voluntary Separation election (filed as Exhibit 10.1 to
Registrant’s Quarterly Report on Form 10-Q for the quarter ended June 30, 2003 and incorporated herein by reference) |
|||||
| 10.18† | Retirement Agreement with David A. Spina (filed as Exhibit 10.1 to Registrant’s Quarterly Report on Form 10-Q for the quarter ended June
30, 2004 and incorporated herein by reference) |
|||||
| 11.1 | Computation of Earnings per Share (information appears in Note 22 of the “Notes to Consolidated Financial Statements” included under
Part II, Item 8. |
|||||
| 12.1 | Statement of ratios of earnings to fixed charges |
|||||
| 21.1 | Subsidiaries of State Street Corporation |
|||||
| 23.1 | Consent of Independent Registered Public Accounting Firm |
|||||
| 31.1 | Rule
13a-14(a)/15d-14(a) Certification |
|||||
| 31.2 | Rule
13a-14(a)/15d-14(a) Certification |
|||||
| 32 | Section 1350 Certifications |
|||||
| † | Denotes management contract or compensatory plan or arrangement |
|||||
By |
/s/ EDWARD J. RESCH EDWARD J. RESCH, Executive Vice President and Chief Financial Officer |
By |
/s/ PAMELA D. GORMLEY PAMELA D. GORMLEY, Executive Vice President and Corporate Controller |
OFFICERS: |
||||||
/s/ RONALD E. LOGUE RONALD E. LOGUE, Chairman and Chief Executive Officer; Director |
/s/ EDWARD J.
RESCH EDWARD J. RESCH, Executive Vice President and Chief Financial Officer |
|||||
/s/ PAMELA D.
GORMLEY PAMELA D. GORMLEY, Executive Vice President and Corporate Controller |
||||||
DIRECTORS: |
||||||
/s/ TENLEY E. ALBRIGHT TENLEY E. ALBRIGHT, M.D. |
/s/ KENNETT F.
BURNES KENNETT F. BURNES |
|||||
/s/ TRUMAN S. CASNER TRUMAN S. CASNER |
/s/ NADER F.
DAREHSHORI NADER F. DAREHSHORI |
|||||
/s/ ARTHUR L. GOLDSTEIN ARTHUR L. GOLDSTEIN |
/s/ DAVID P.
GRUBER DAVID P. GRUBER |
|||||
/s/ LINDA A. HILL LINDA A. HILL |
/s/ CHARLES R.
LAMANTIA CHARLES R. LAMANTIA |
|||||
/s/ RONALD E. LOGUE RONALD E. LOGUE |
/s/ RICHARD P.
SERGEL RICHARD P. SERGEL |
|||||
/s/ RONALD L. SKATES RONALD L. SKATES |
/s/ GREGORY L.
SUMME GREGORY L. SUMME |
|||||
/s/ DIANA CHAPMAN WALSH DIANA CHAPMAN WALSH |
/s/ ROBERT E.
WEISSMAN ROBERT E. WEISSMAN |
|||||
| 10.3A | Schedule B to Amended and Restated Supplemental Defined Benefit Pension Plan for Senior Executive Officers as applicable to J.
Hooley |
|||||
| 12.1 | Statement of ratios of earnings to fixed charges |
|||||
| 21.1 | Subsidiaries of State Street Corporation |
|||||
| 23.1 | Consent of Independent Registered Public Accounting Firm |
|||||
| 31.1 | Rule
13a-14(a)/15d-14(a) Certification |
|||||
| 31.2 | Rule
13a-14(a)/15d-14(a) Certification |
|||||
| 32 | Section 1350 Certifications |
|||||